Prop Alpha
Prop Alpha Pro Studies
Over 30+ custom structural and volume-based tools, including the Signal Series, for Futures, Stocks, Crypto and Forex.
Prop-Alpha Pro allows traders access to custom settings for refining each tool to any product on any timeframe. The Signal Series, included in Prop-Alpha Pro, features tools that give traders the power to design their own signals, instantly backtest those signals to refine risk and deploy their strategies automatically with a custom BOT.
All this PLUS all the Basic Studies are included.
*Requires Sierra Charts Package 11 or higher.
Signal Series & Pro-only studies
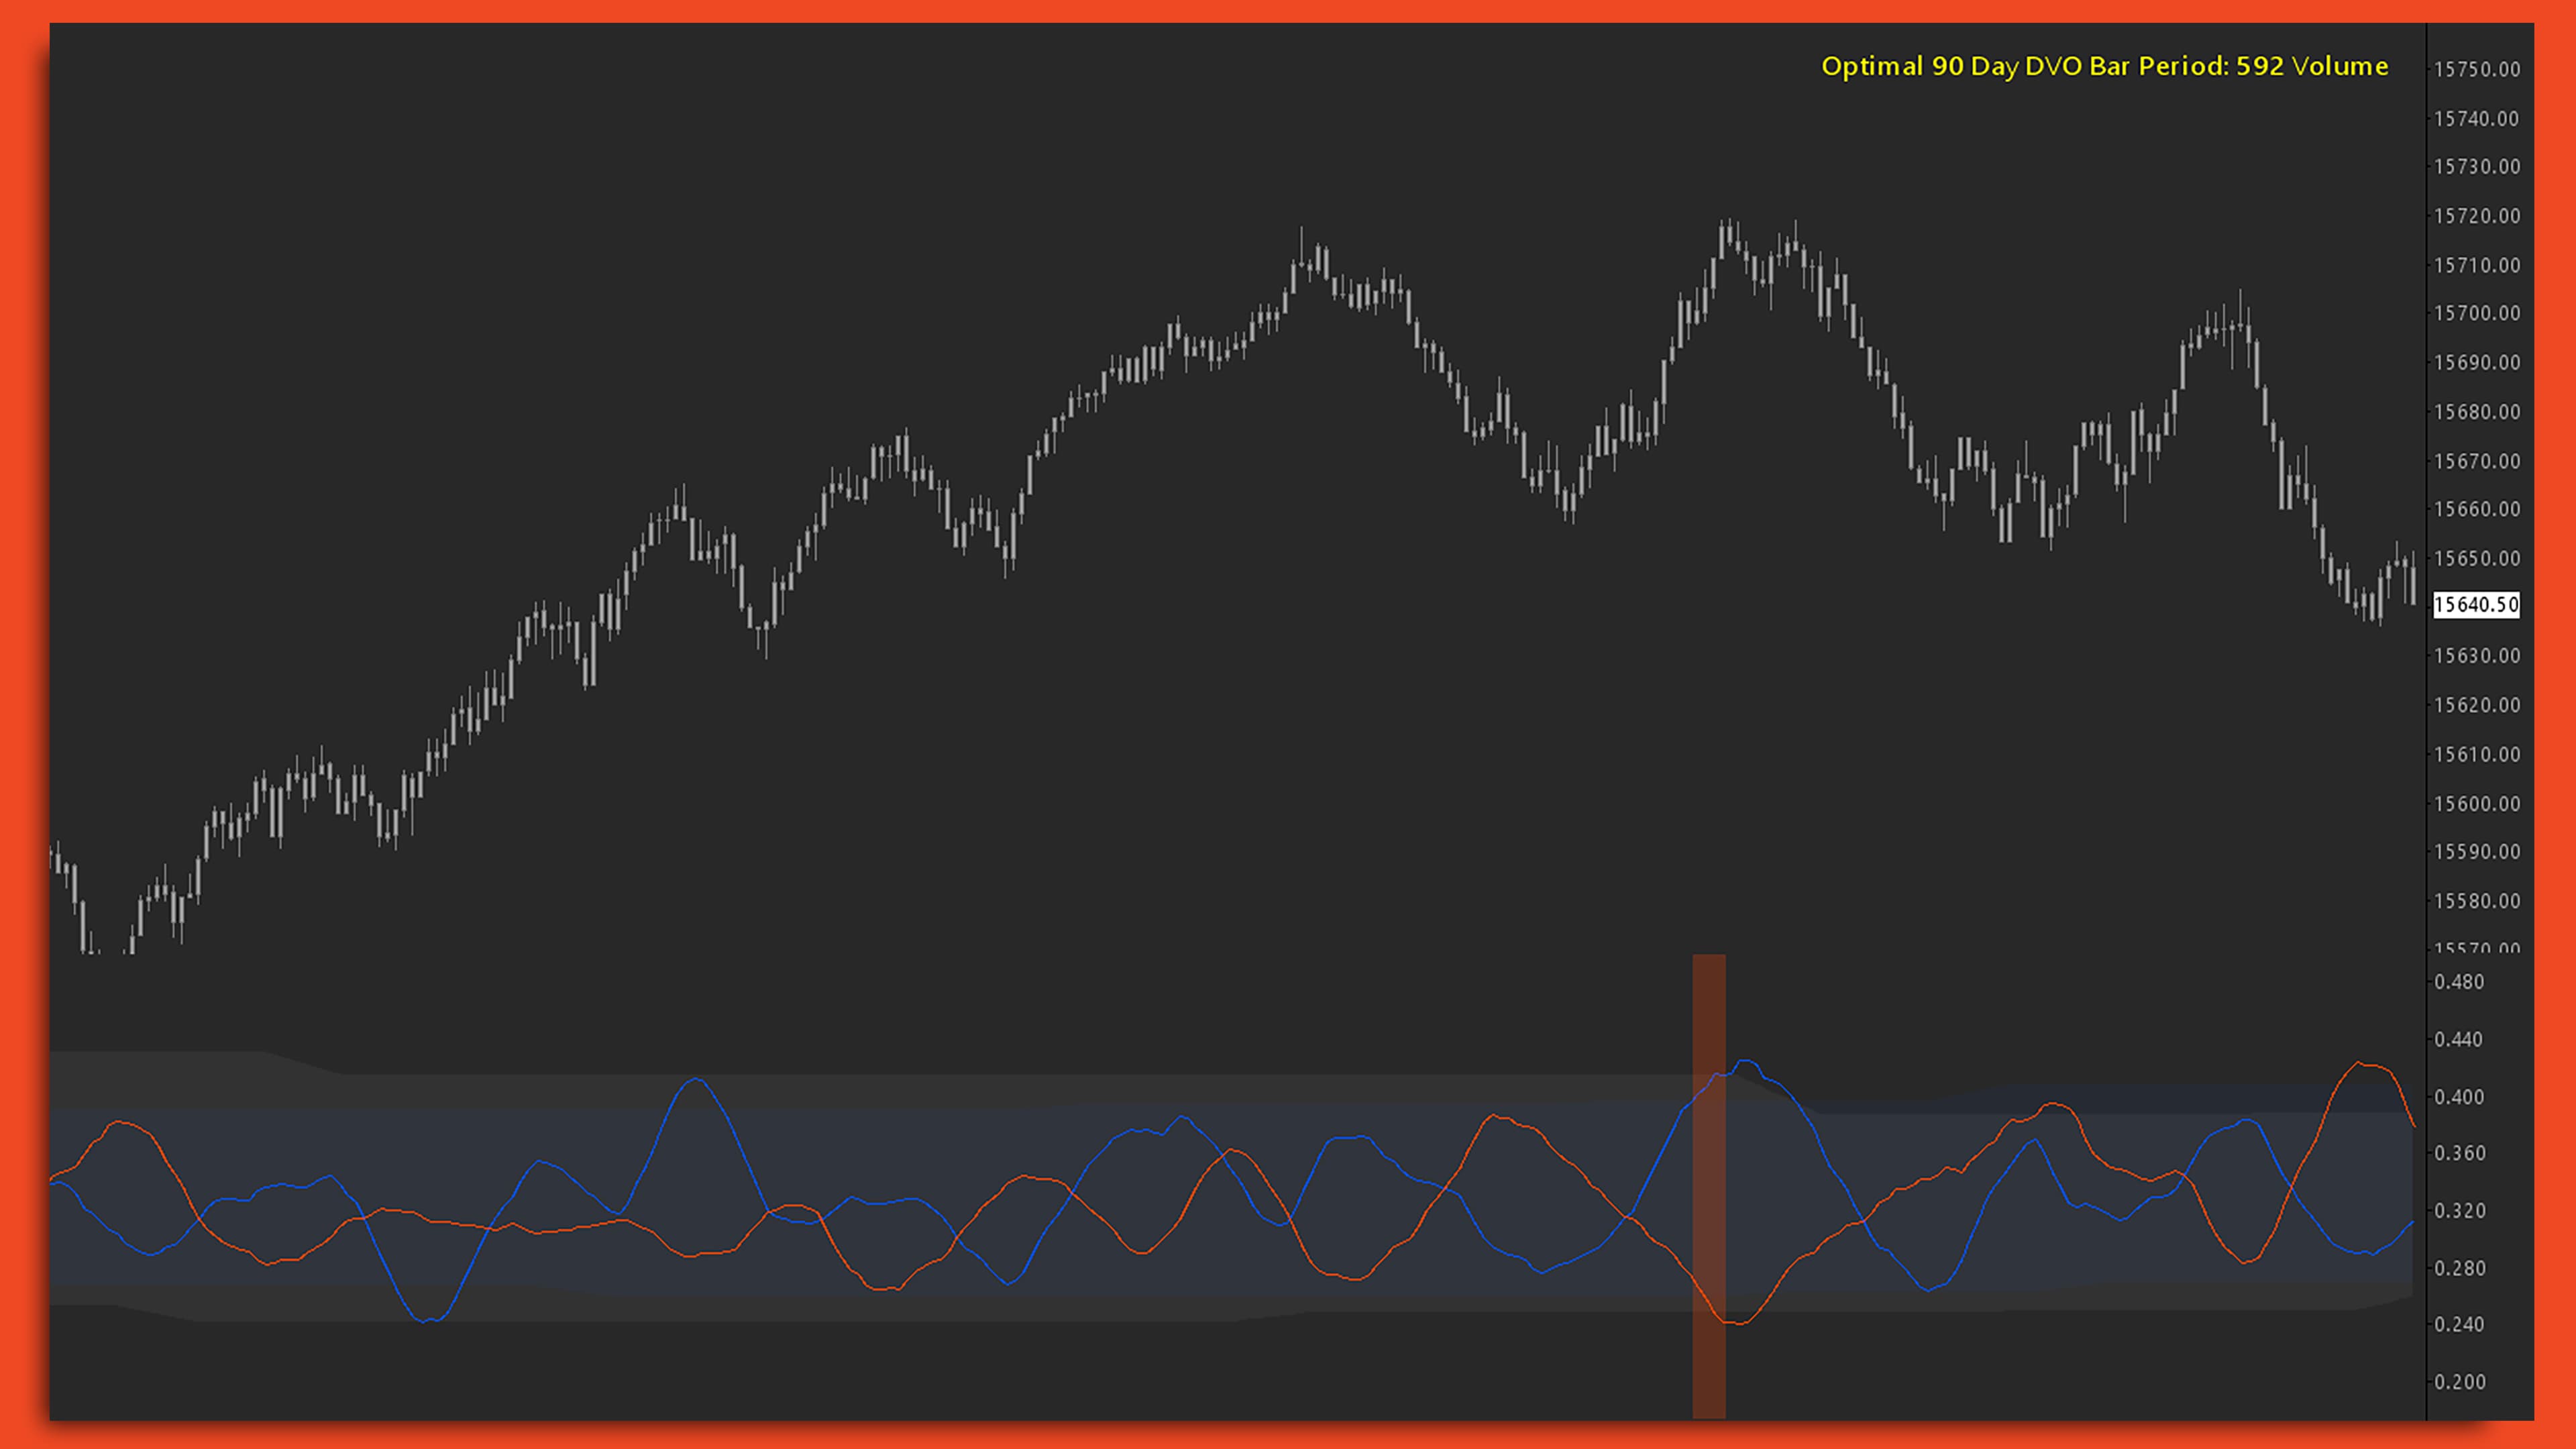
DVO Metrics
Based on volume after an up or down tick, the DVO Metrics study determines the correct volume per bar chart setting, for any product, for the Delta-Volume Oscillator, DVO Spread, and Bid-Offer Exhaustion.
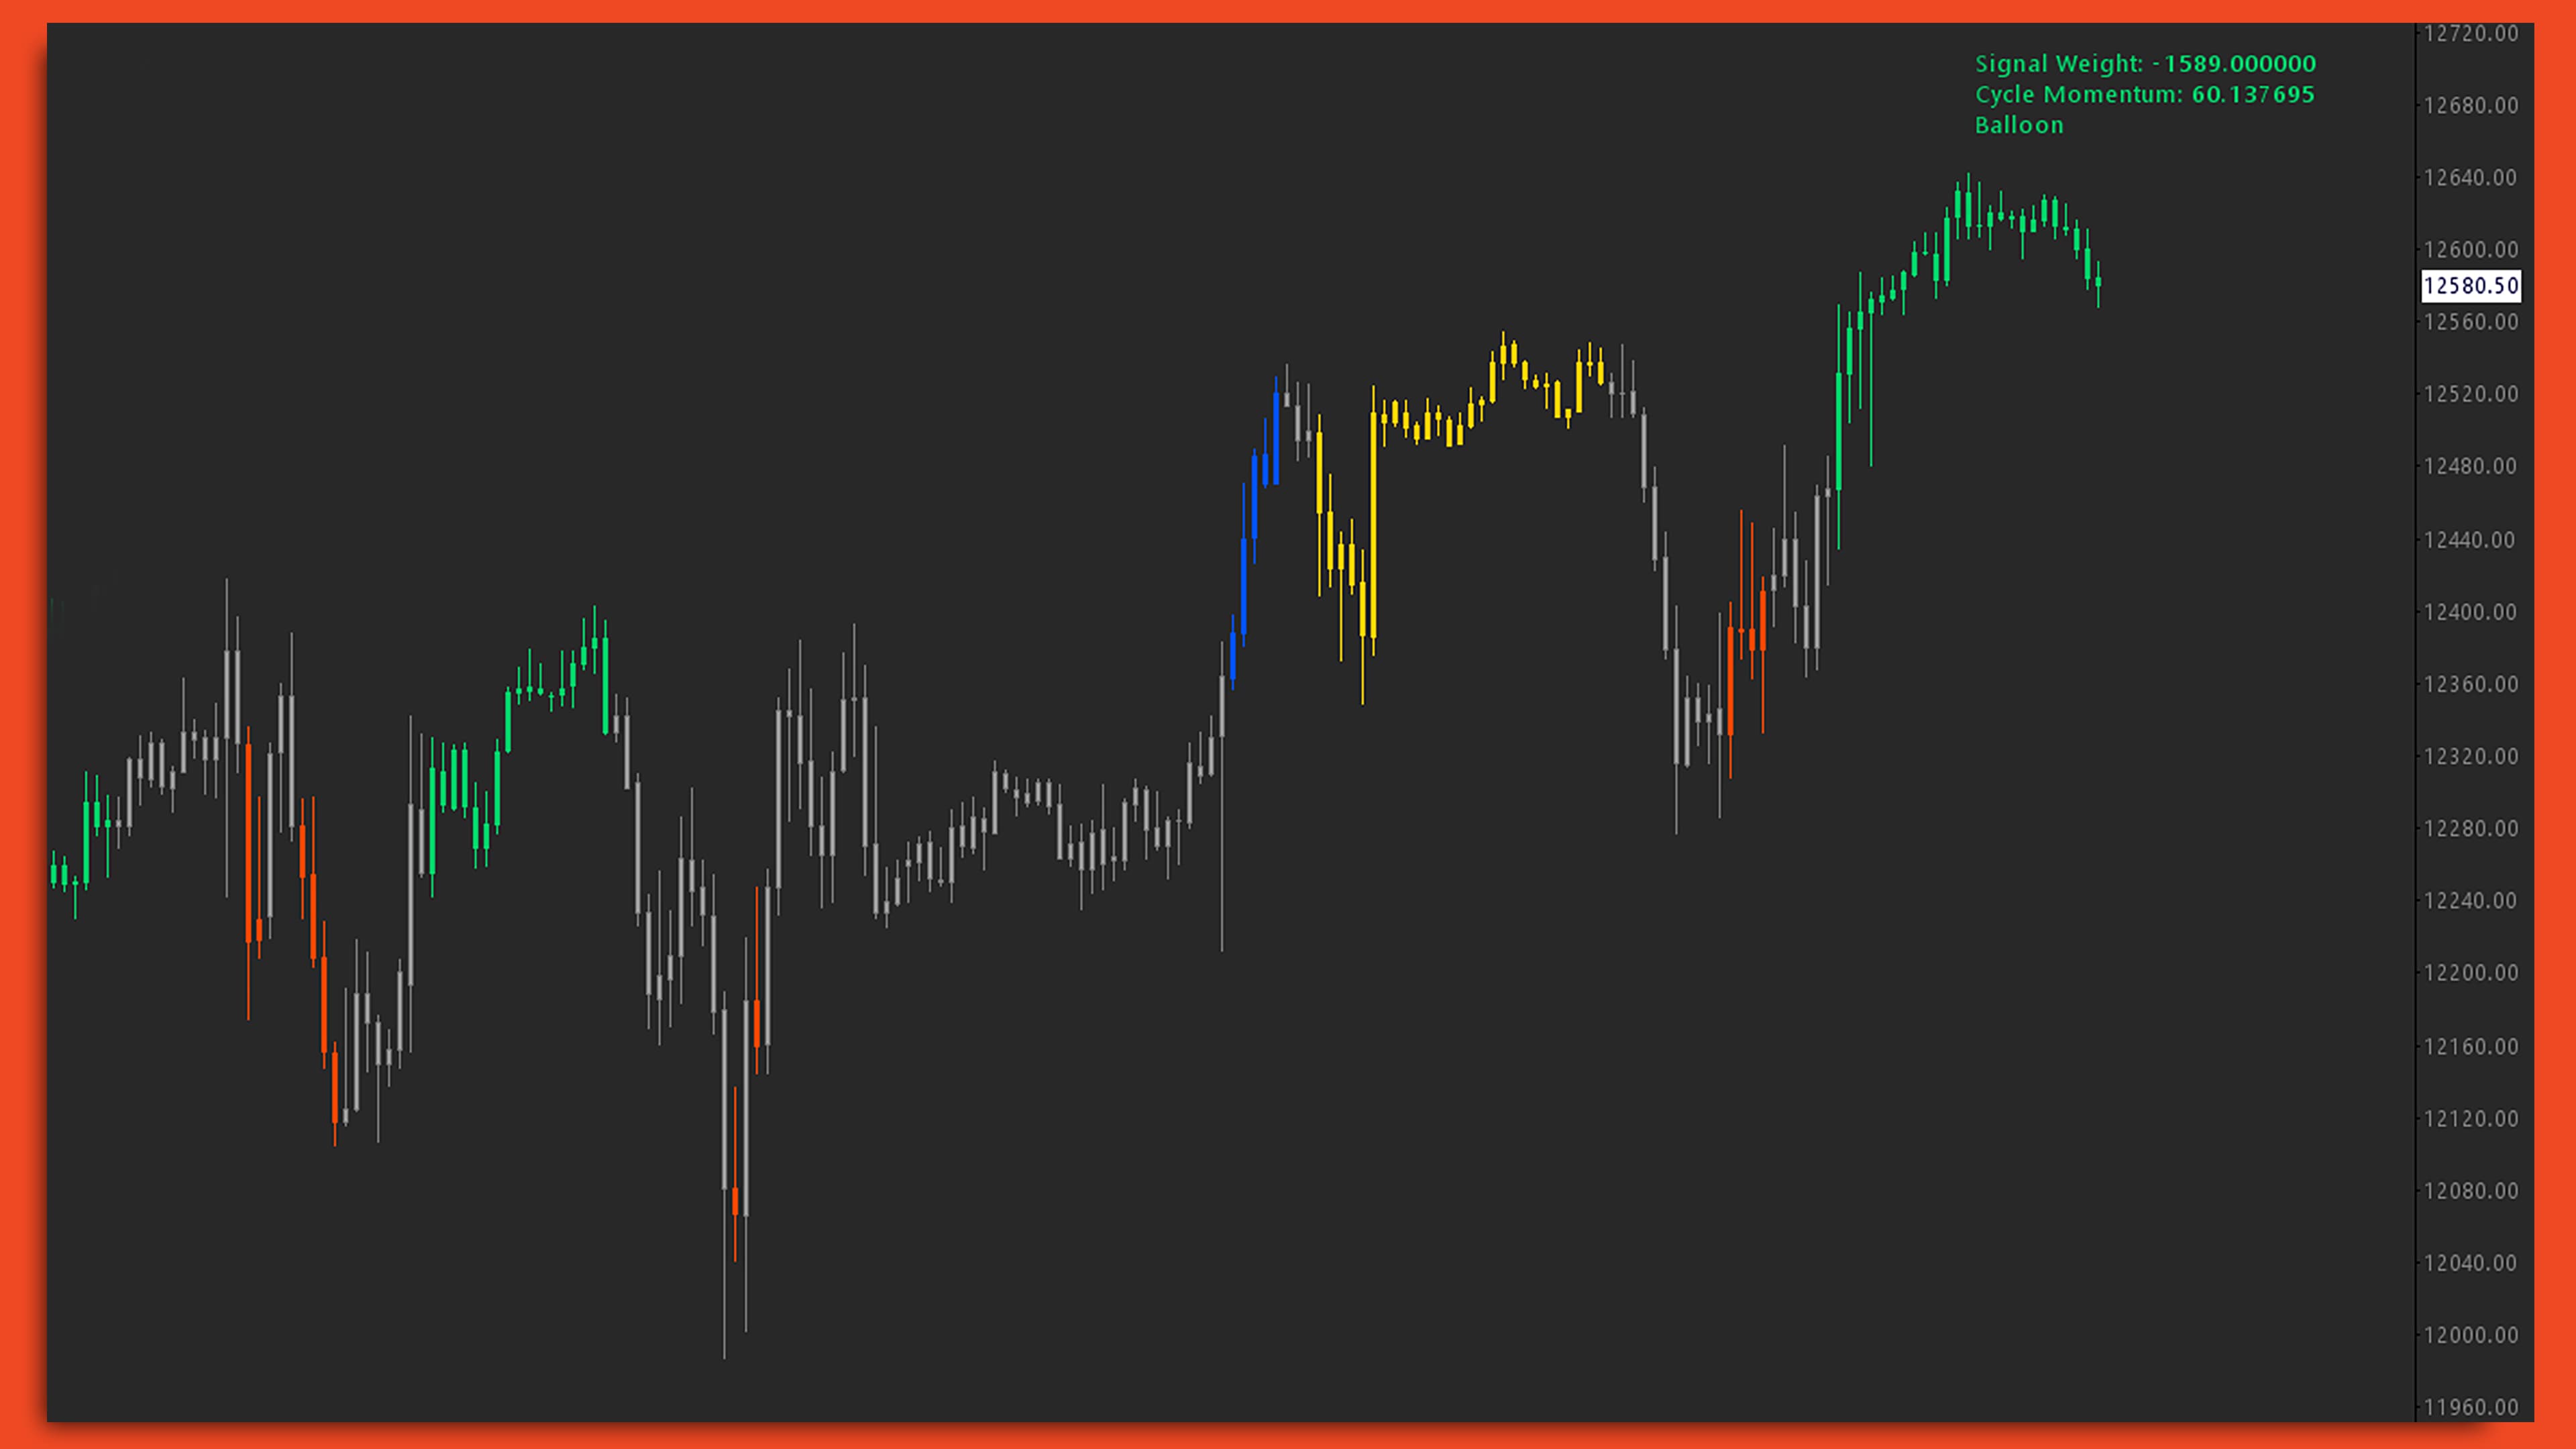
Market Internals
Track dynamics in market momentum by monitoring statistics derived from breadth indicators. The Market Internals study automatically calculates and displays bullish momentum, bearish momentum, bullish reversal conditions ('balloon') and bearish reversal conditions ('led zeppelin').
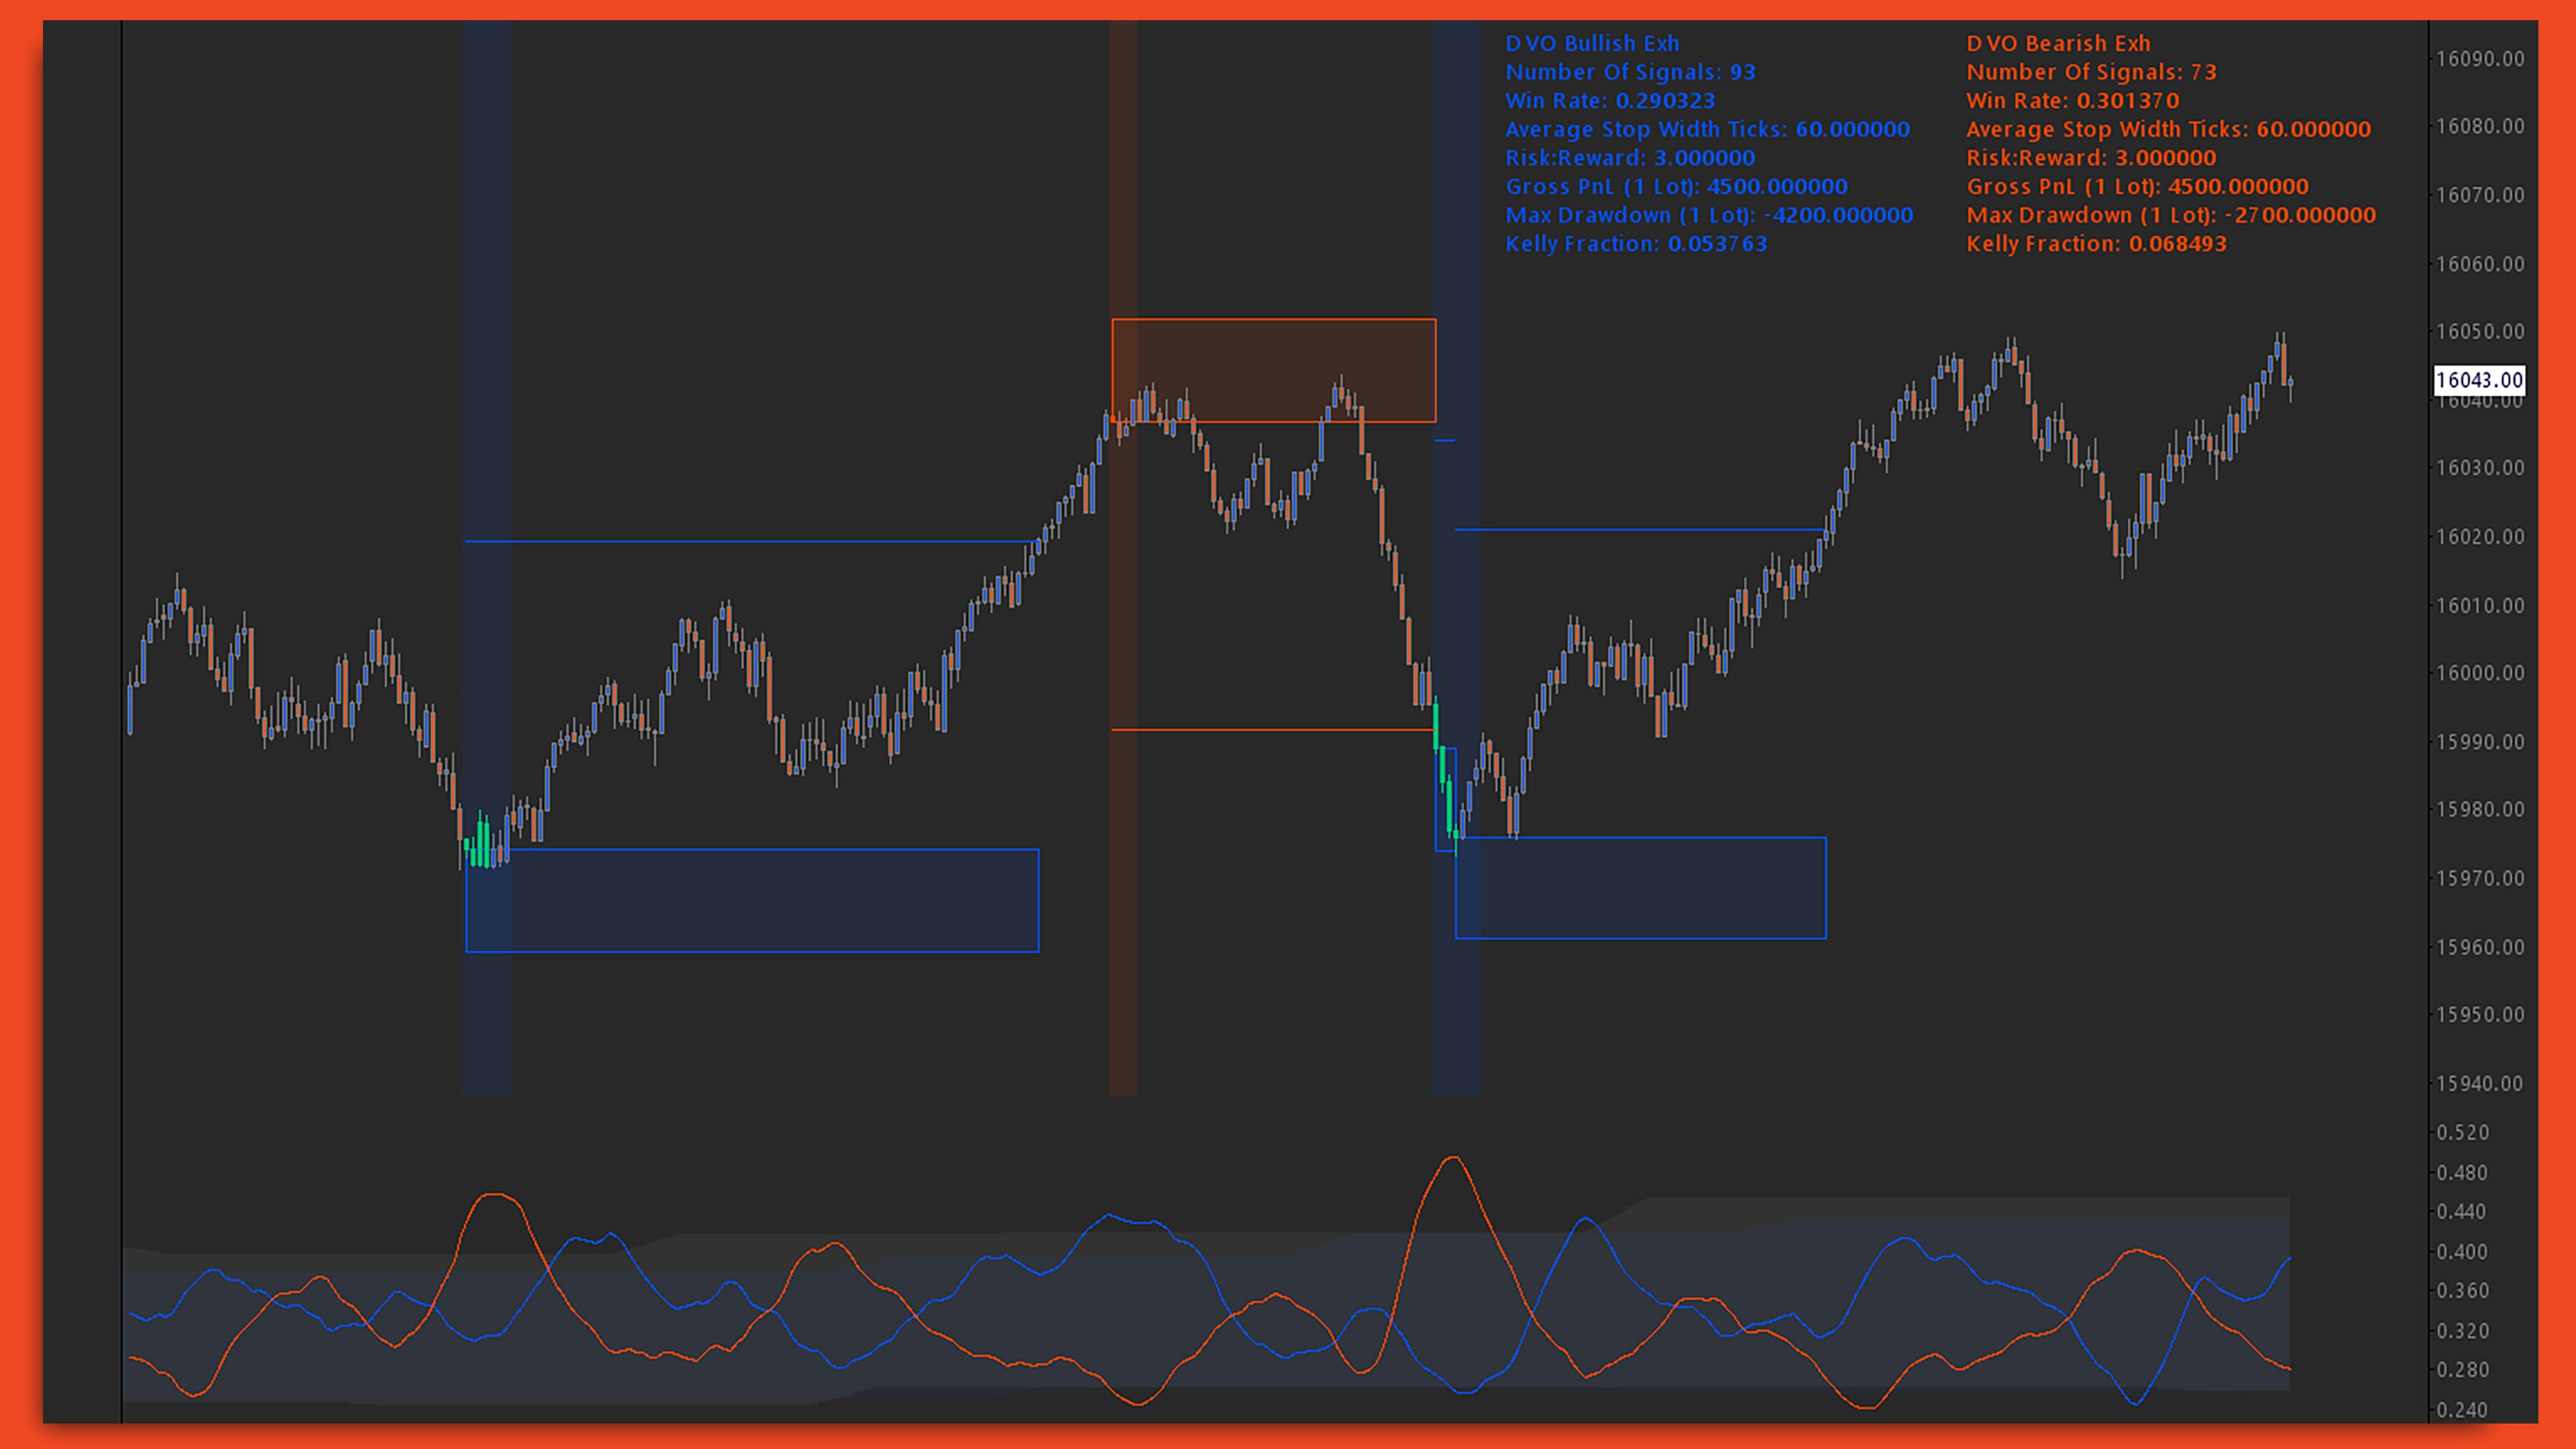
Signal Backtester
Instantaneously receive feedback on a signal's win rate, average stoploss, gross profit and loss, max drawdown, and Kelly fraction. Signal Backtester eliminates the downtime of rigorous chart replay to quickly evaluate a trade thesis and estimate historical risk skews.
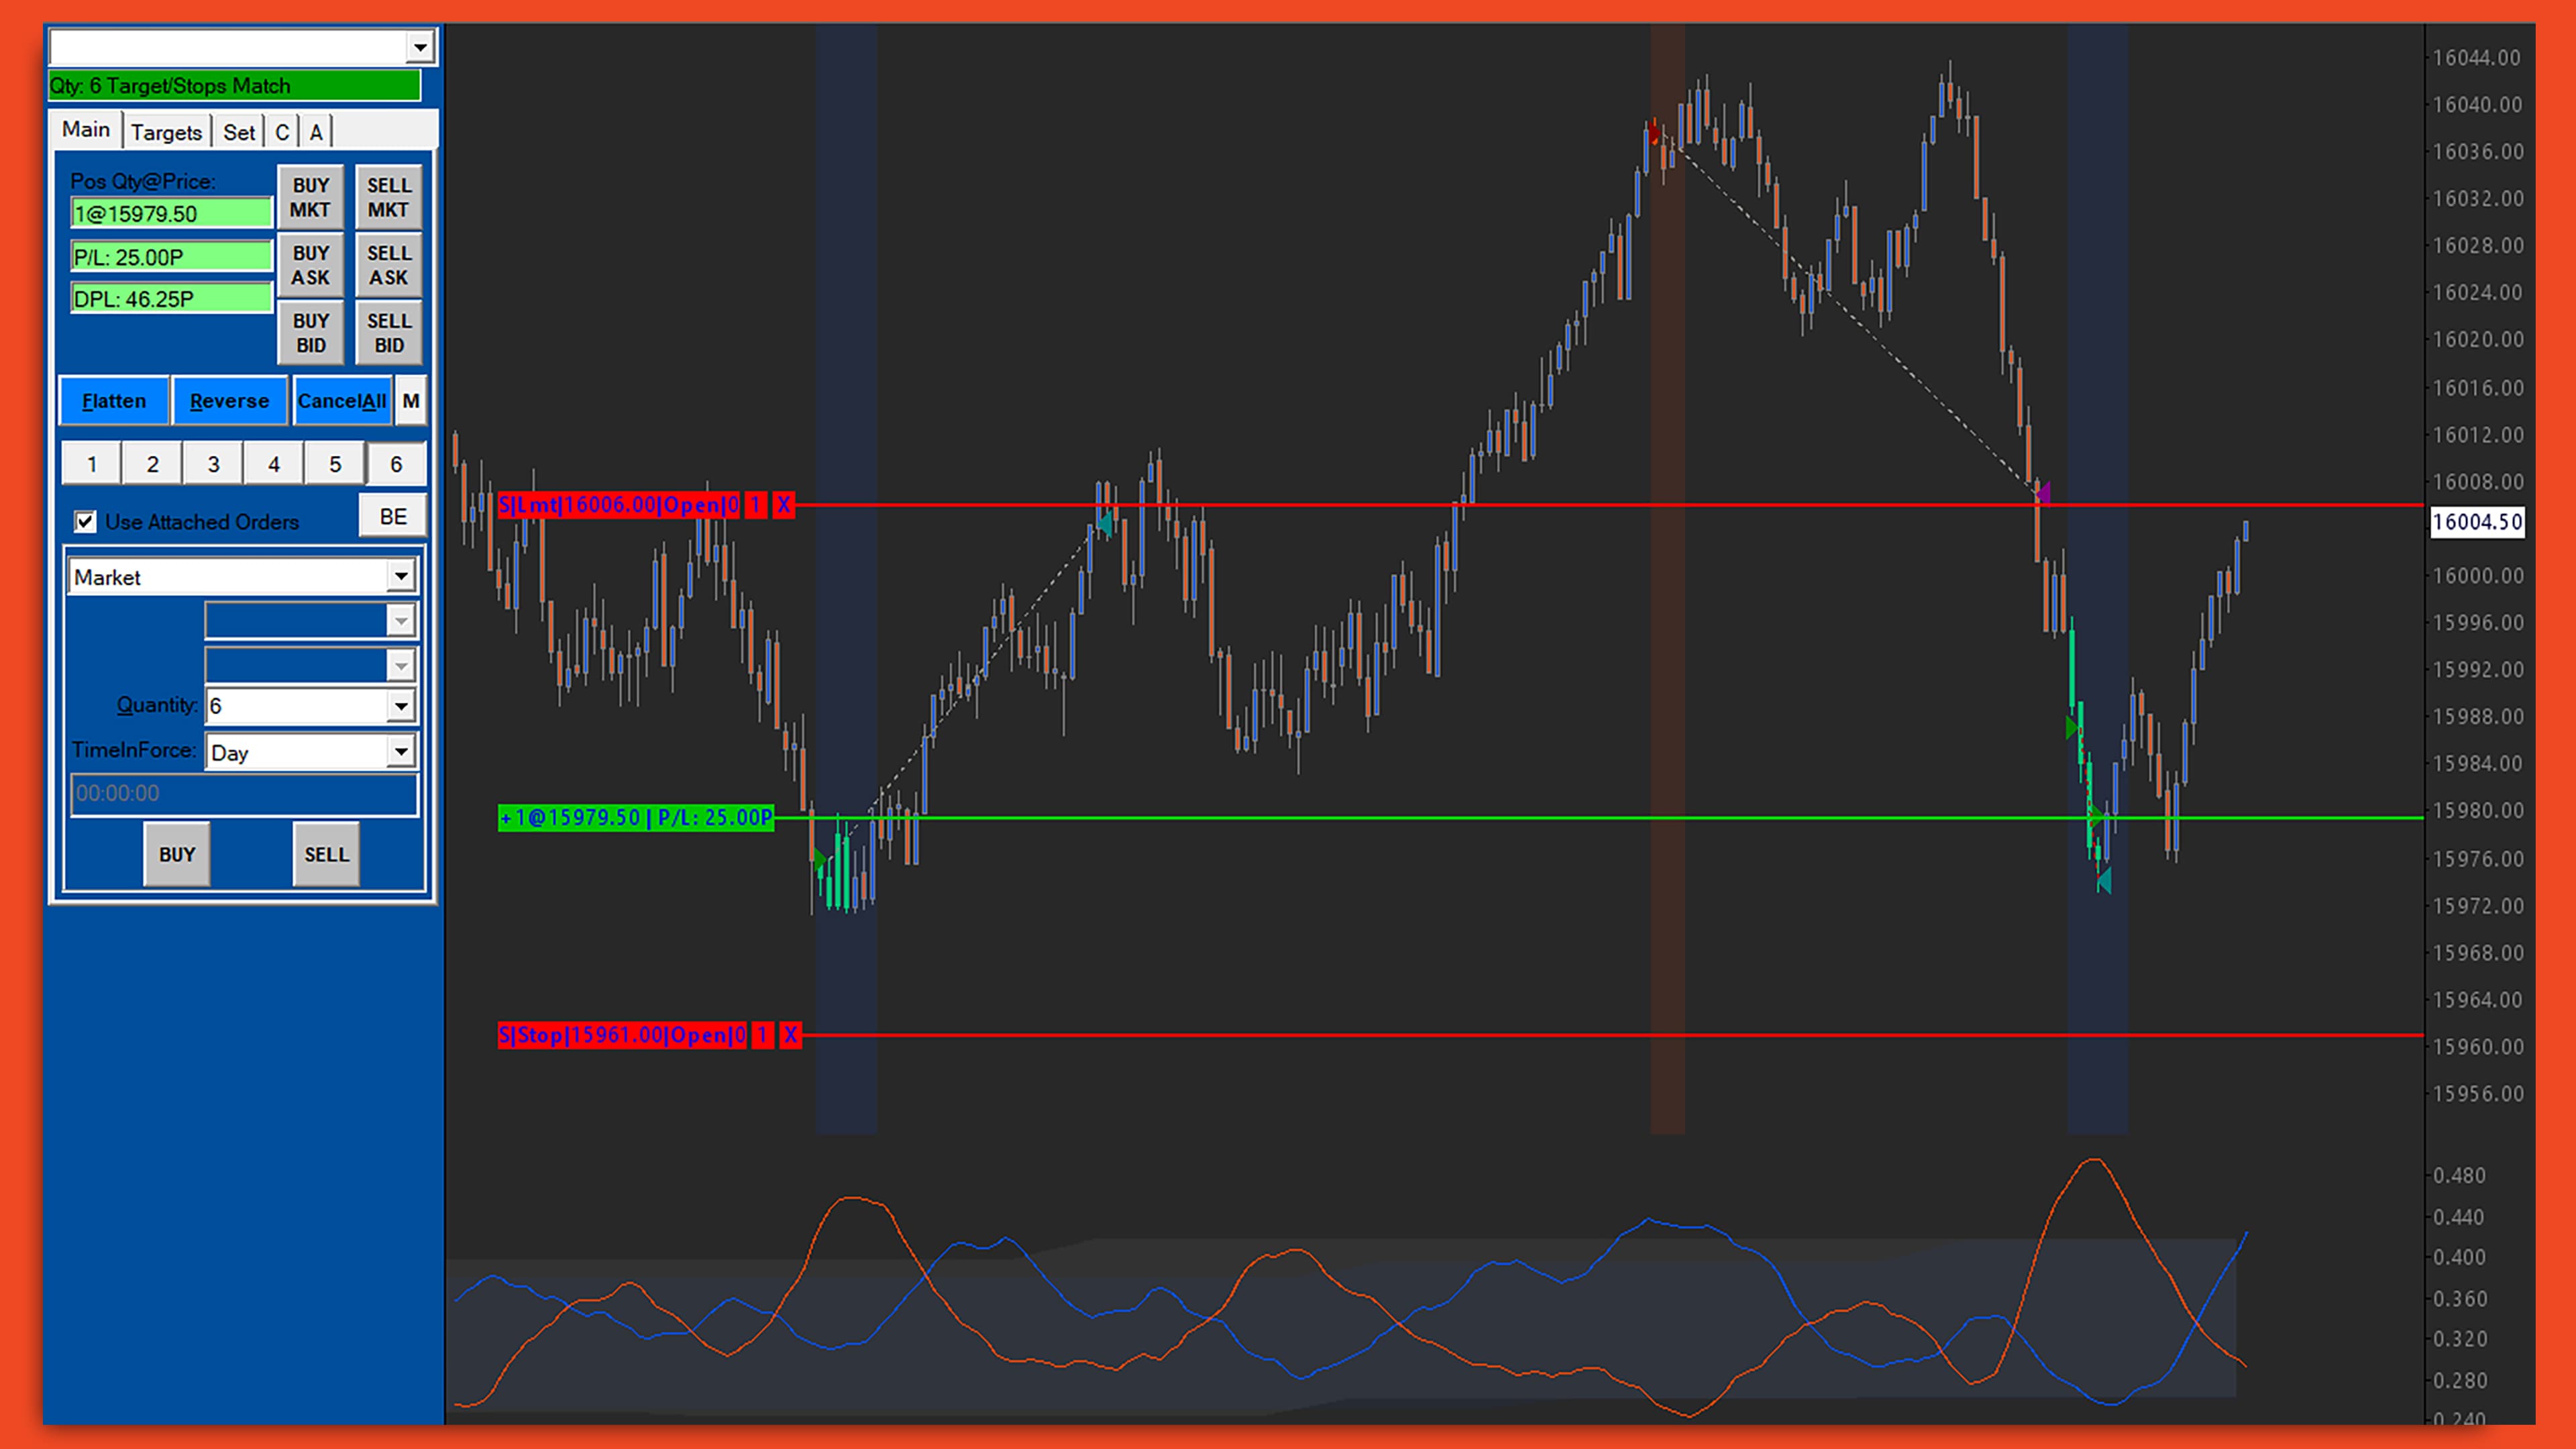
Signal Deployer
Automate execution of your strategy, including order type, stoploss variations, take profit variations, slippage adjustments, and much more. Signal Deployer gives traders the ability to connect to any signal or subgraph and auto-trade custom strategies with ease.
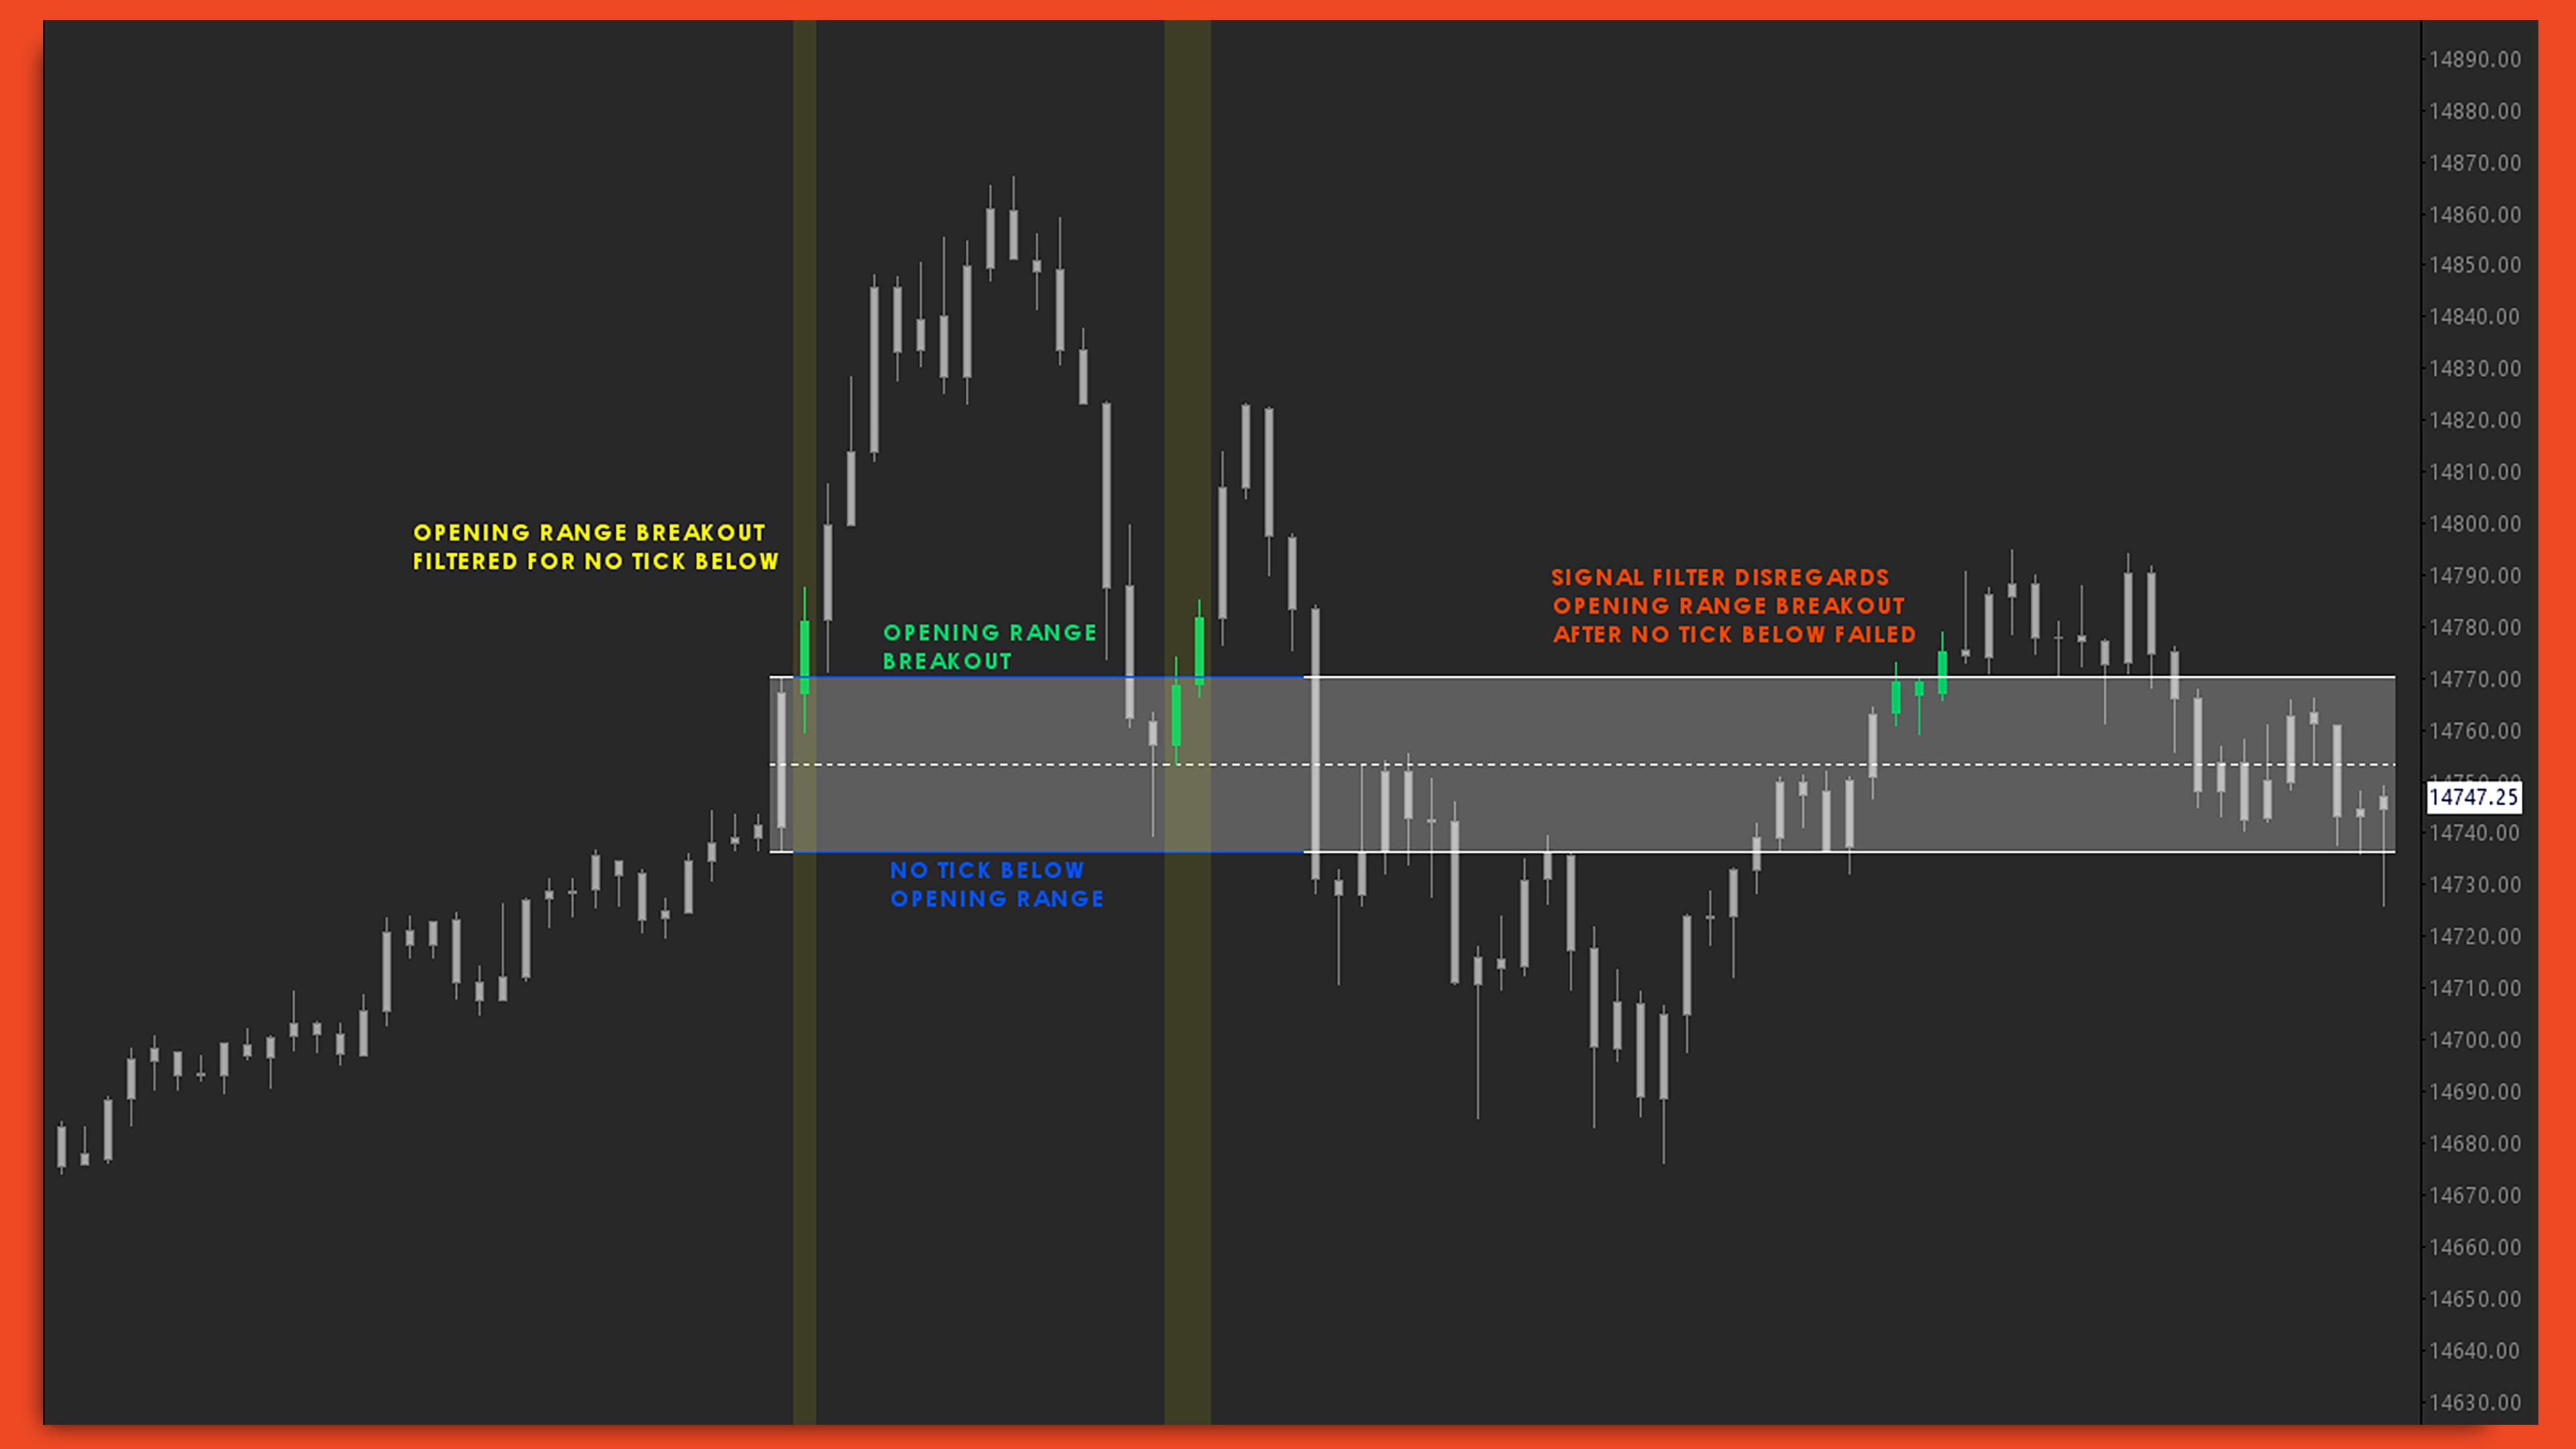
Signal Filter
Add a filter to any signal for a positive, negative or non-zero correlation to additional factors to improve your historical profit and loss, drawdown, risk skew, or Kelly fraction. Signal Filter allows you to focus on signals printing during advantageous market conditions or eliminate signals printing during adverse market conditions.
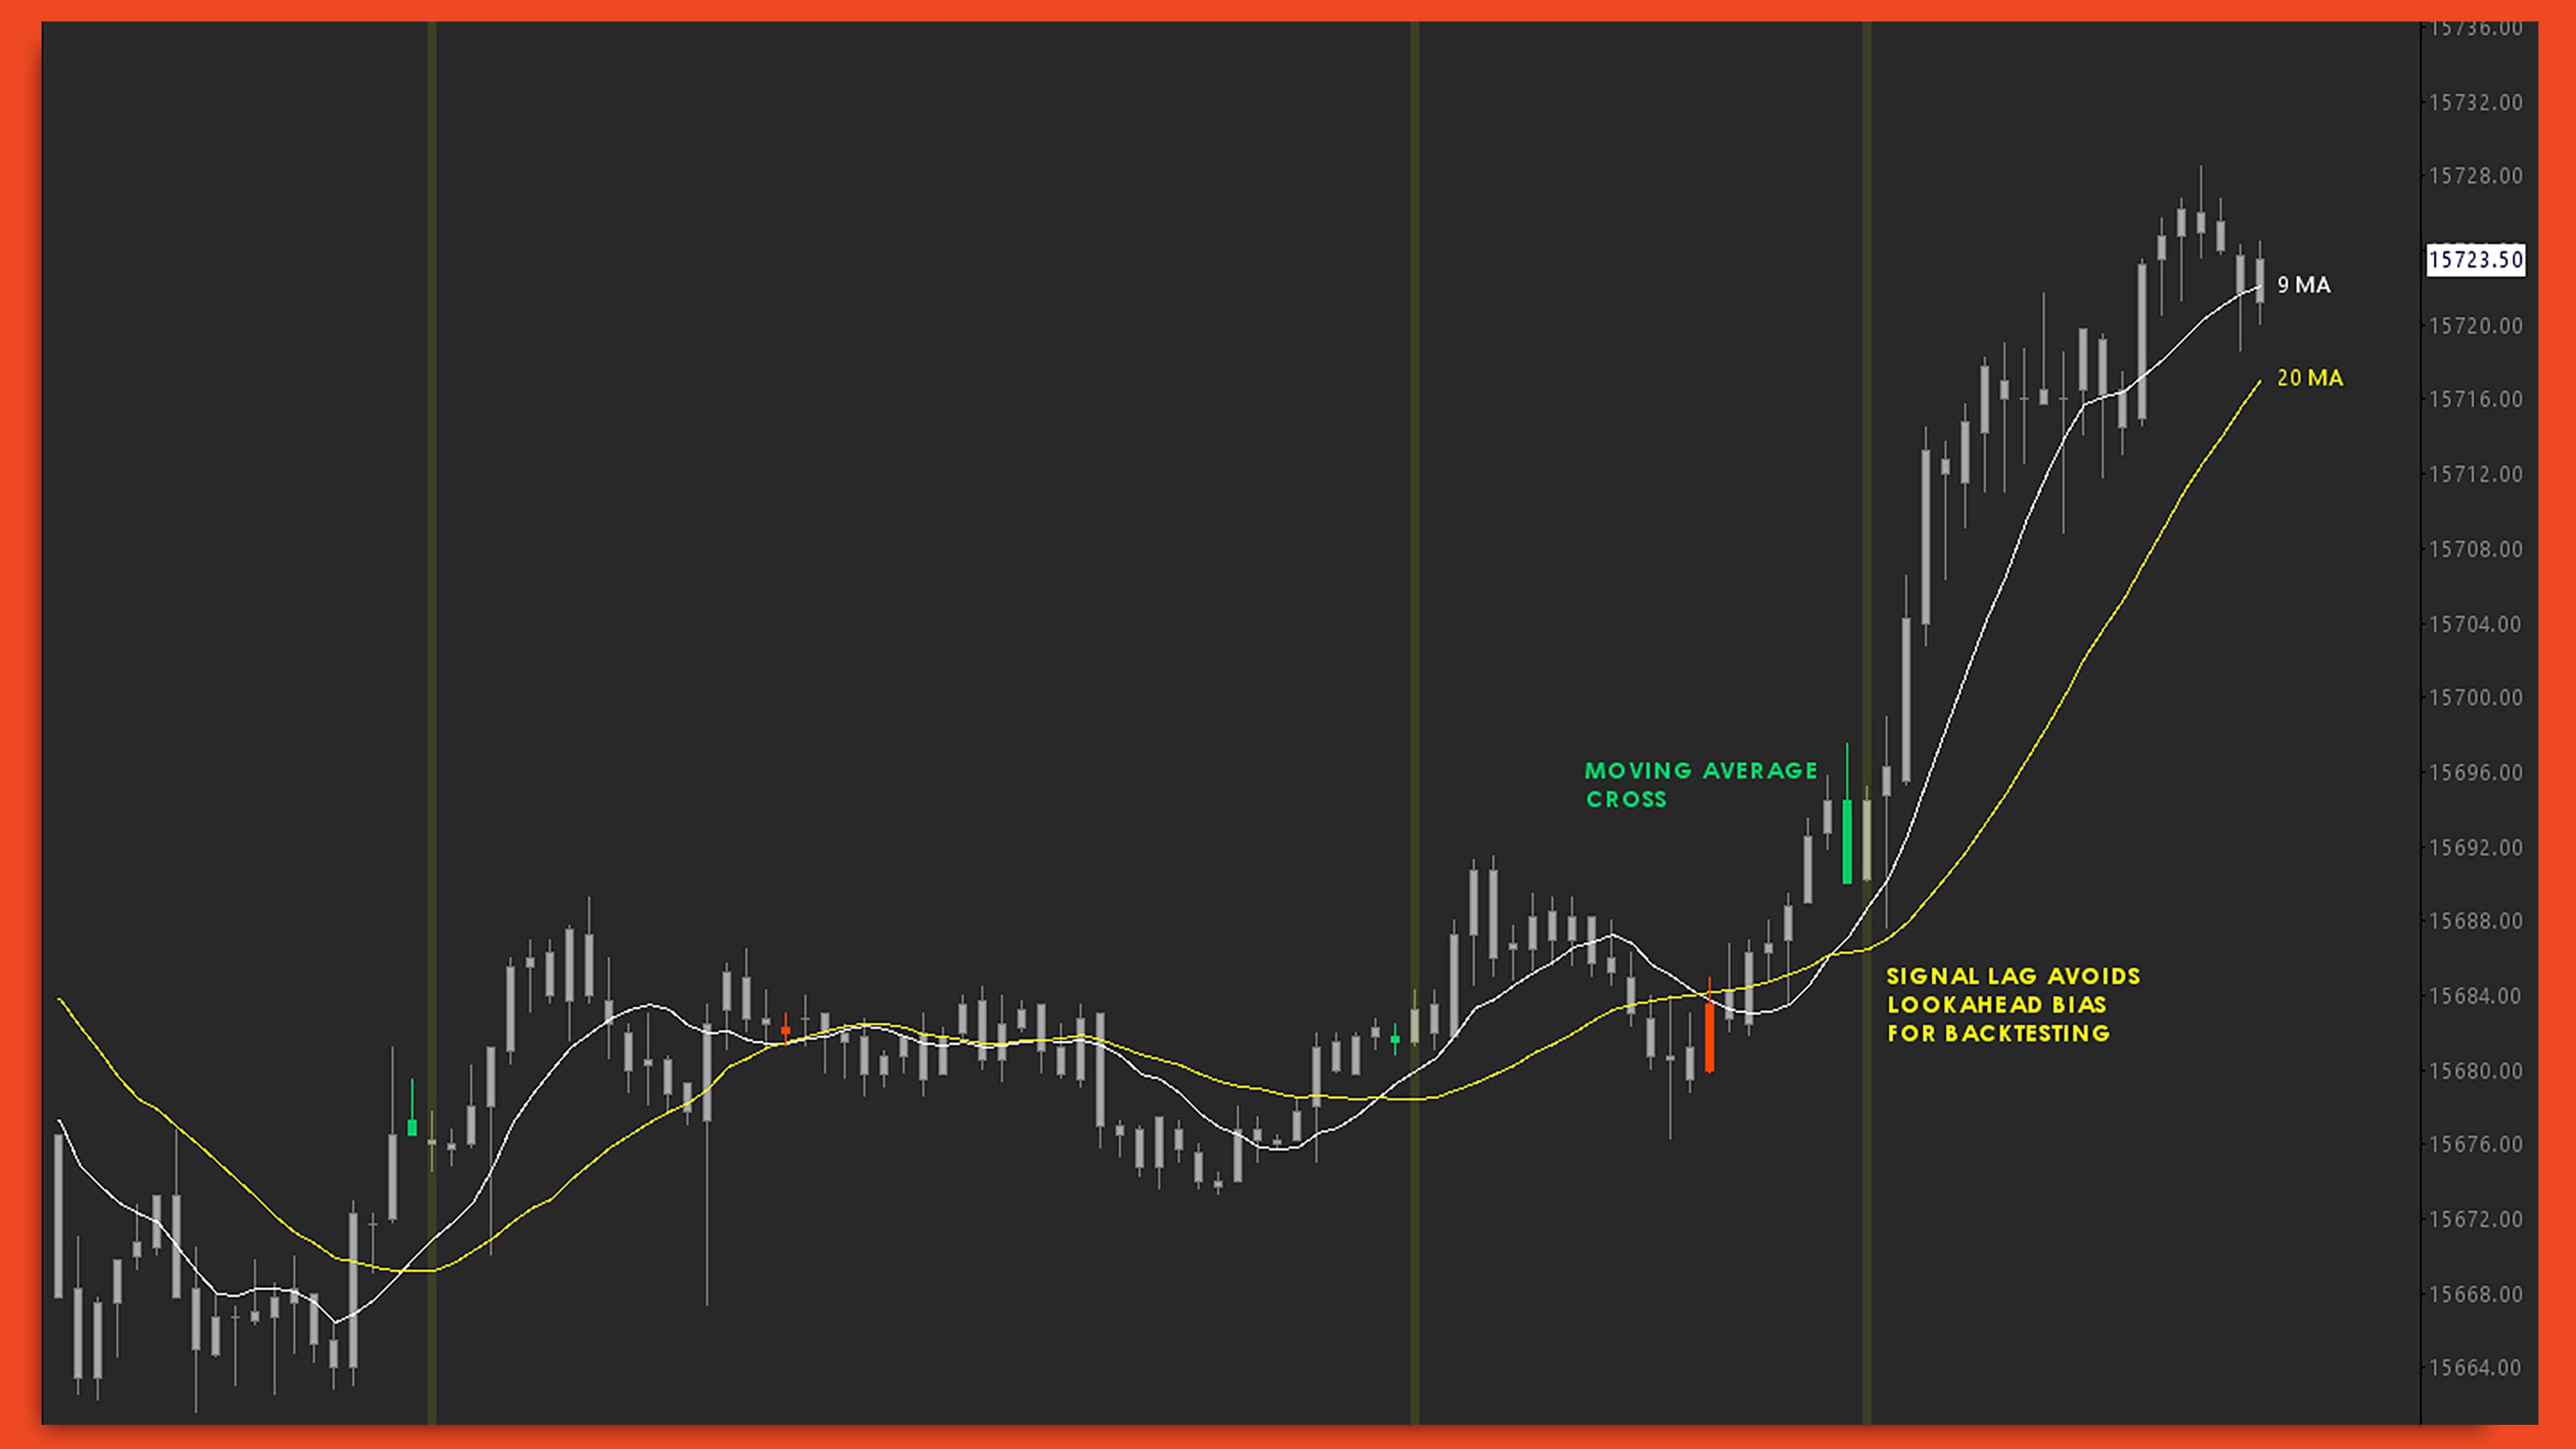
Signal Lag Series
A bar-based delay for any signal or subgraph to be used when overlaying from the higher timeframes. Signal Lag Series provides traders additional protection against lookahead bias while backtesting.
Signal Repetition
Identify patterns when a bullish or bearish signal repeats in consecutive order. Signal Repetition can be used to create advanced Signal Combos or to simply delay the entry on signals which tend to fire sequentially.
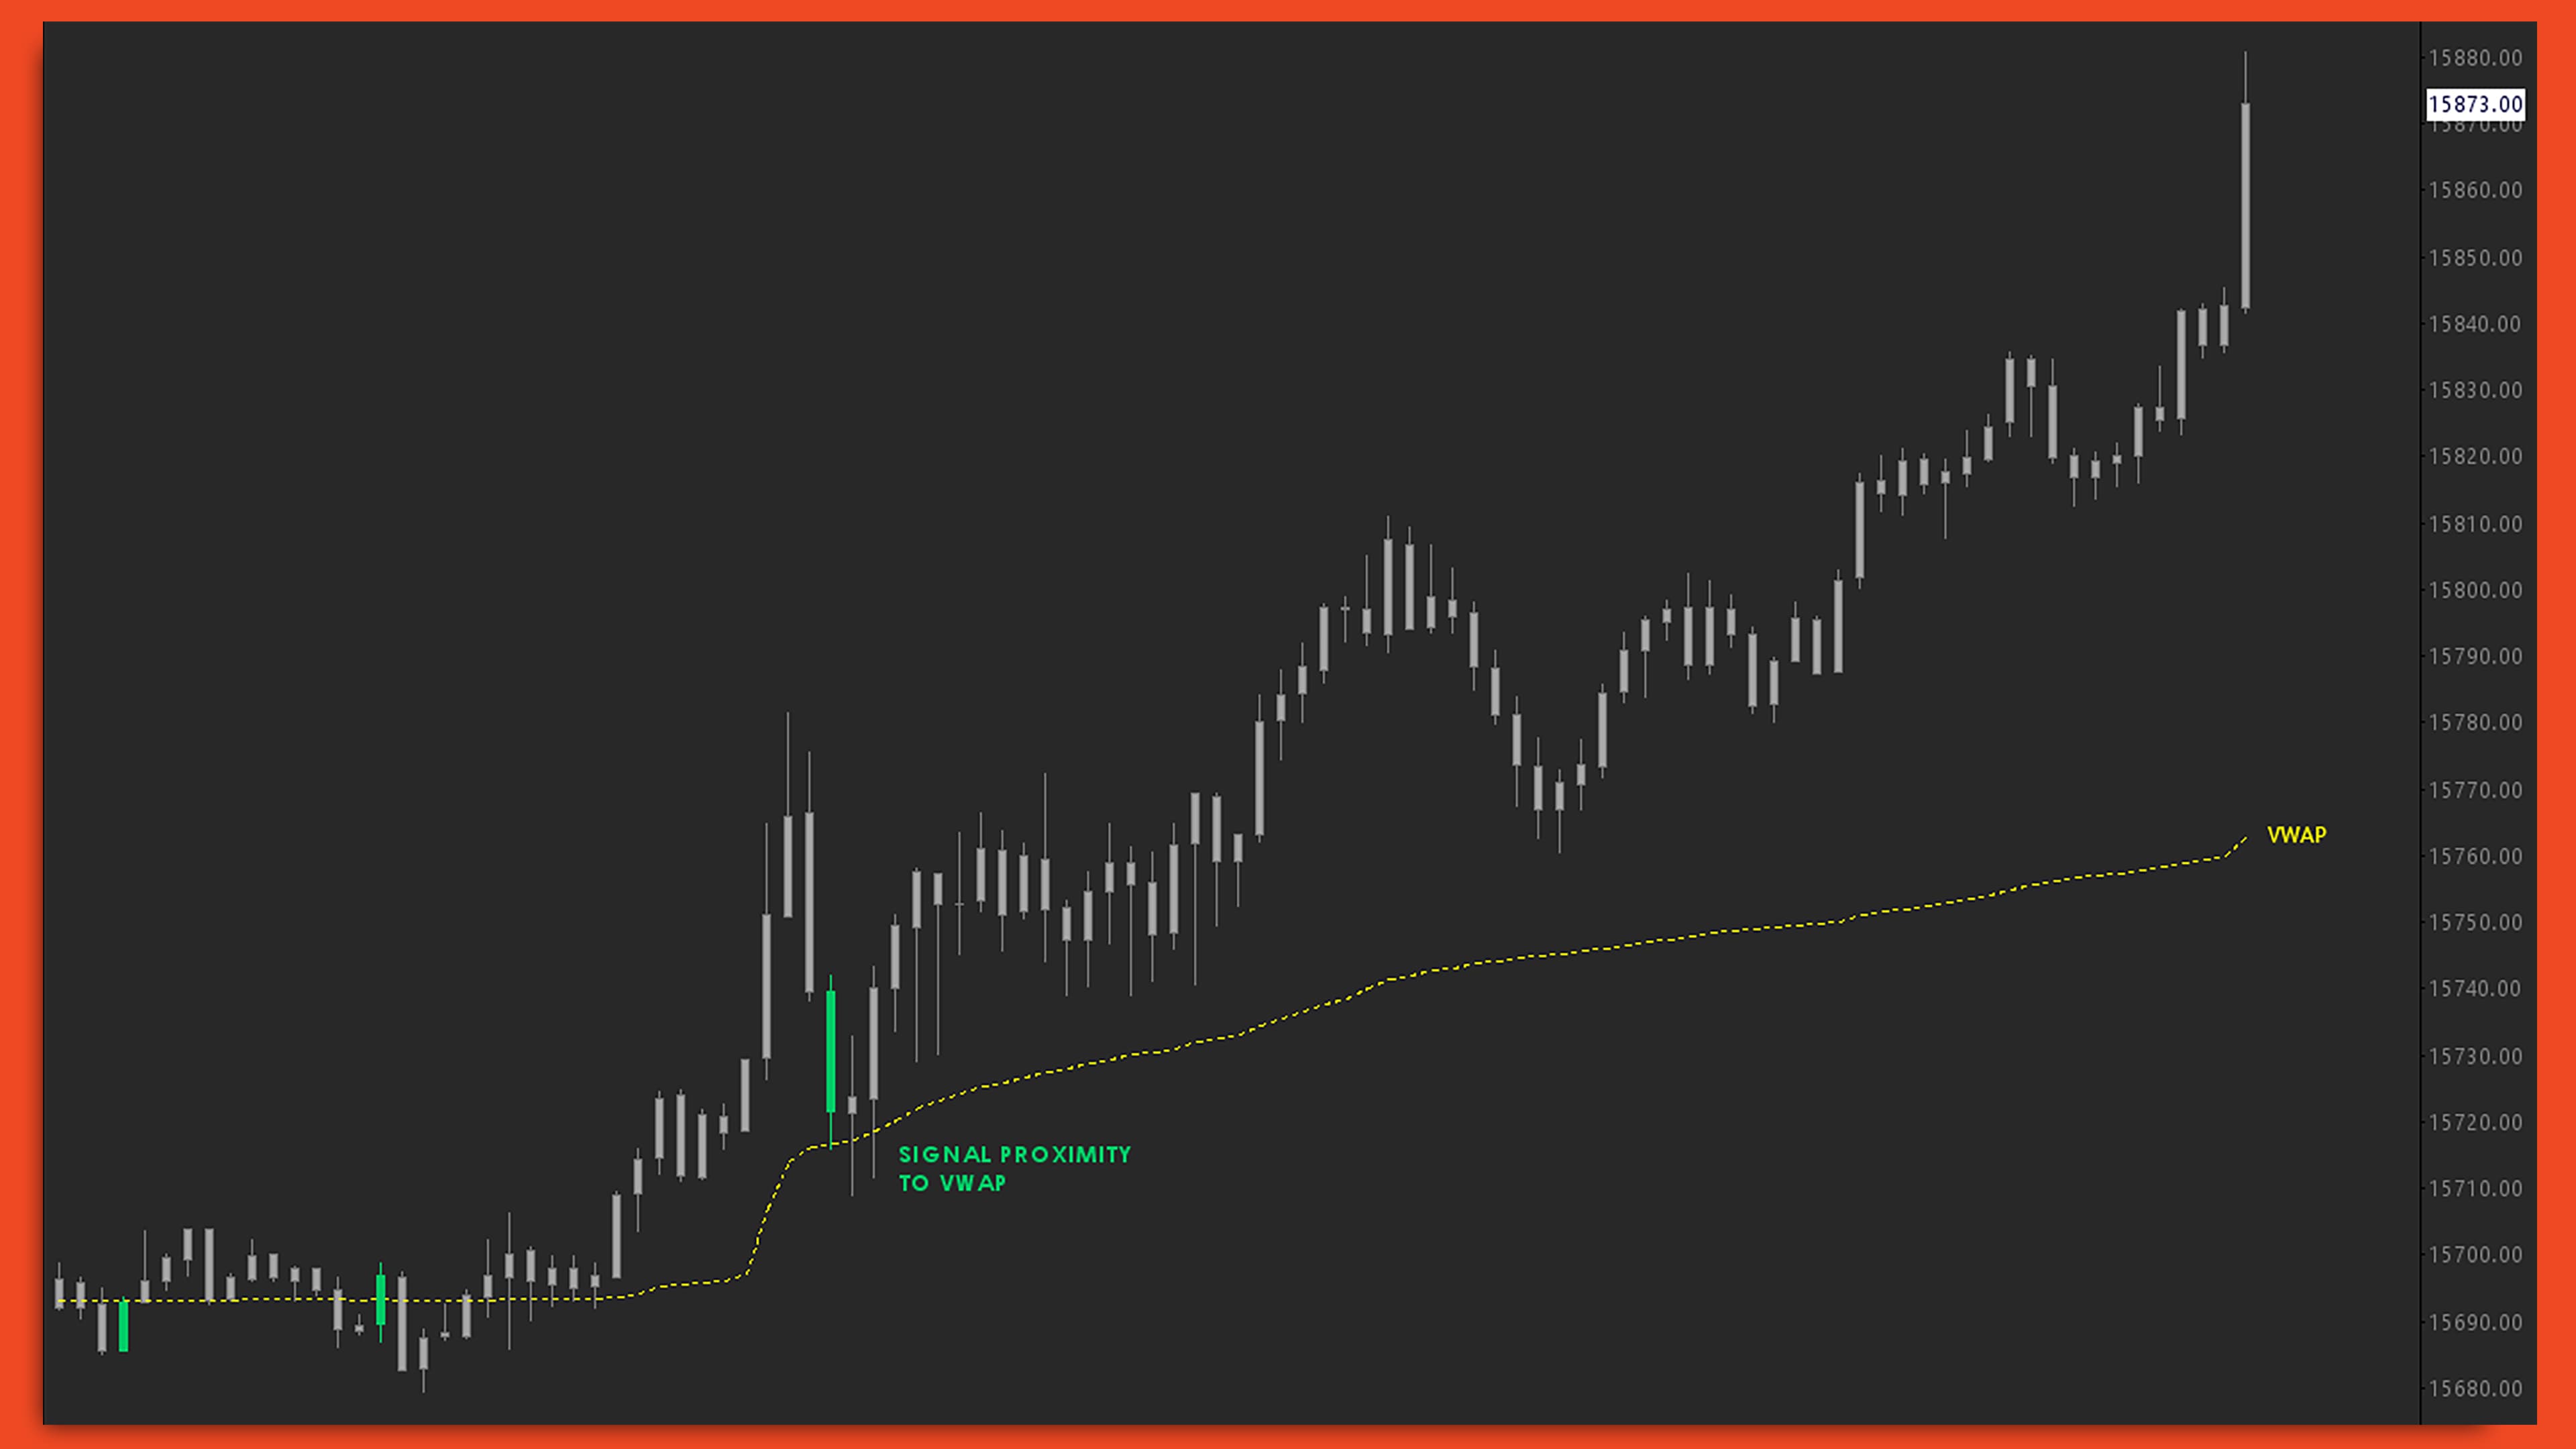
Signal Subgraph Proximity
Create a signal based on current price proximity, within a range of ticks, to any subgraph. Signal Subgraph Proximity detects how close price is to an area of interest, filters for time intervals between touches, and lets the user label them as buy signals, sell signals, or neutral ('pure proximity') signals.
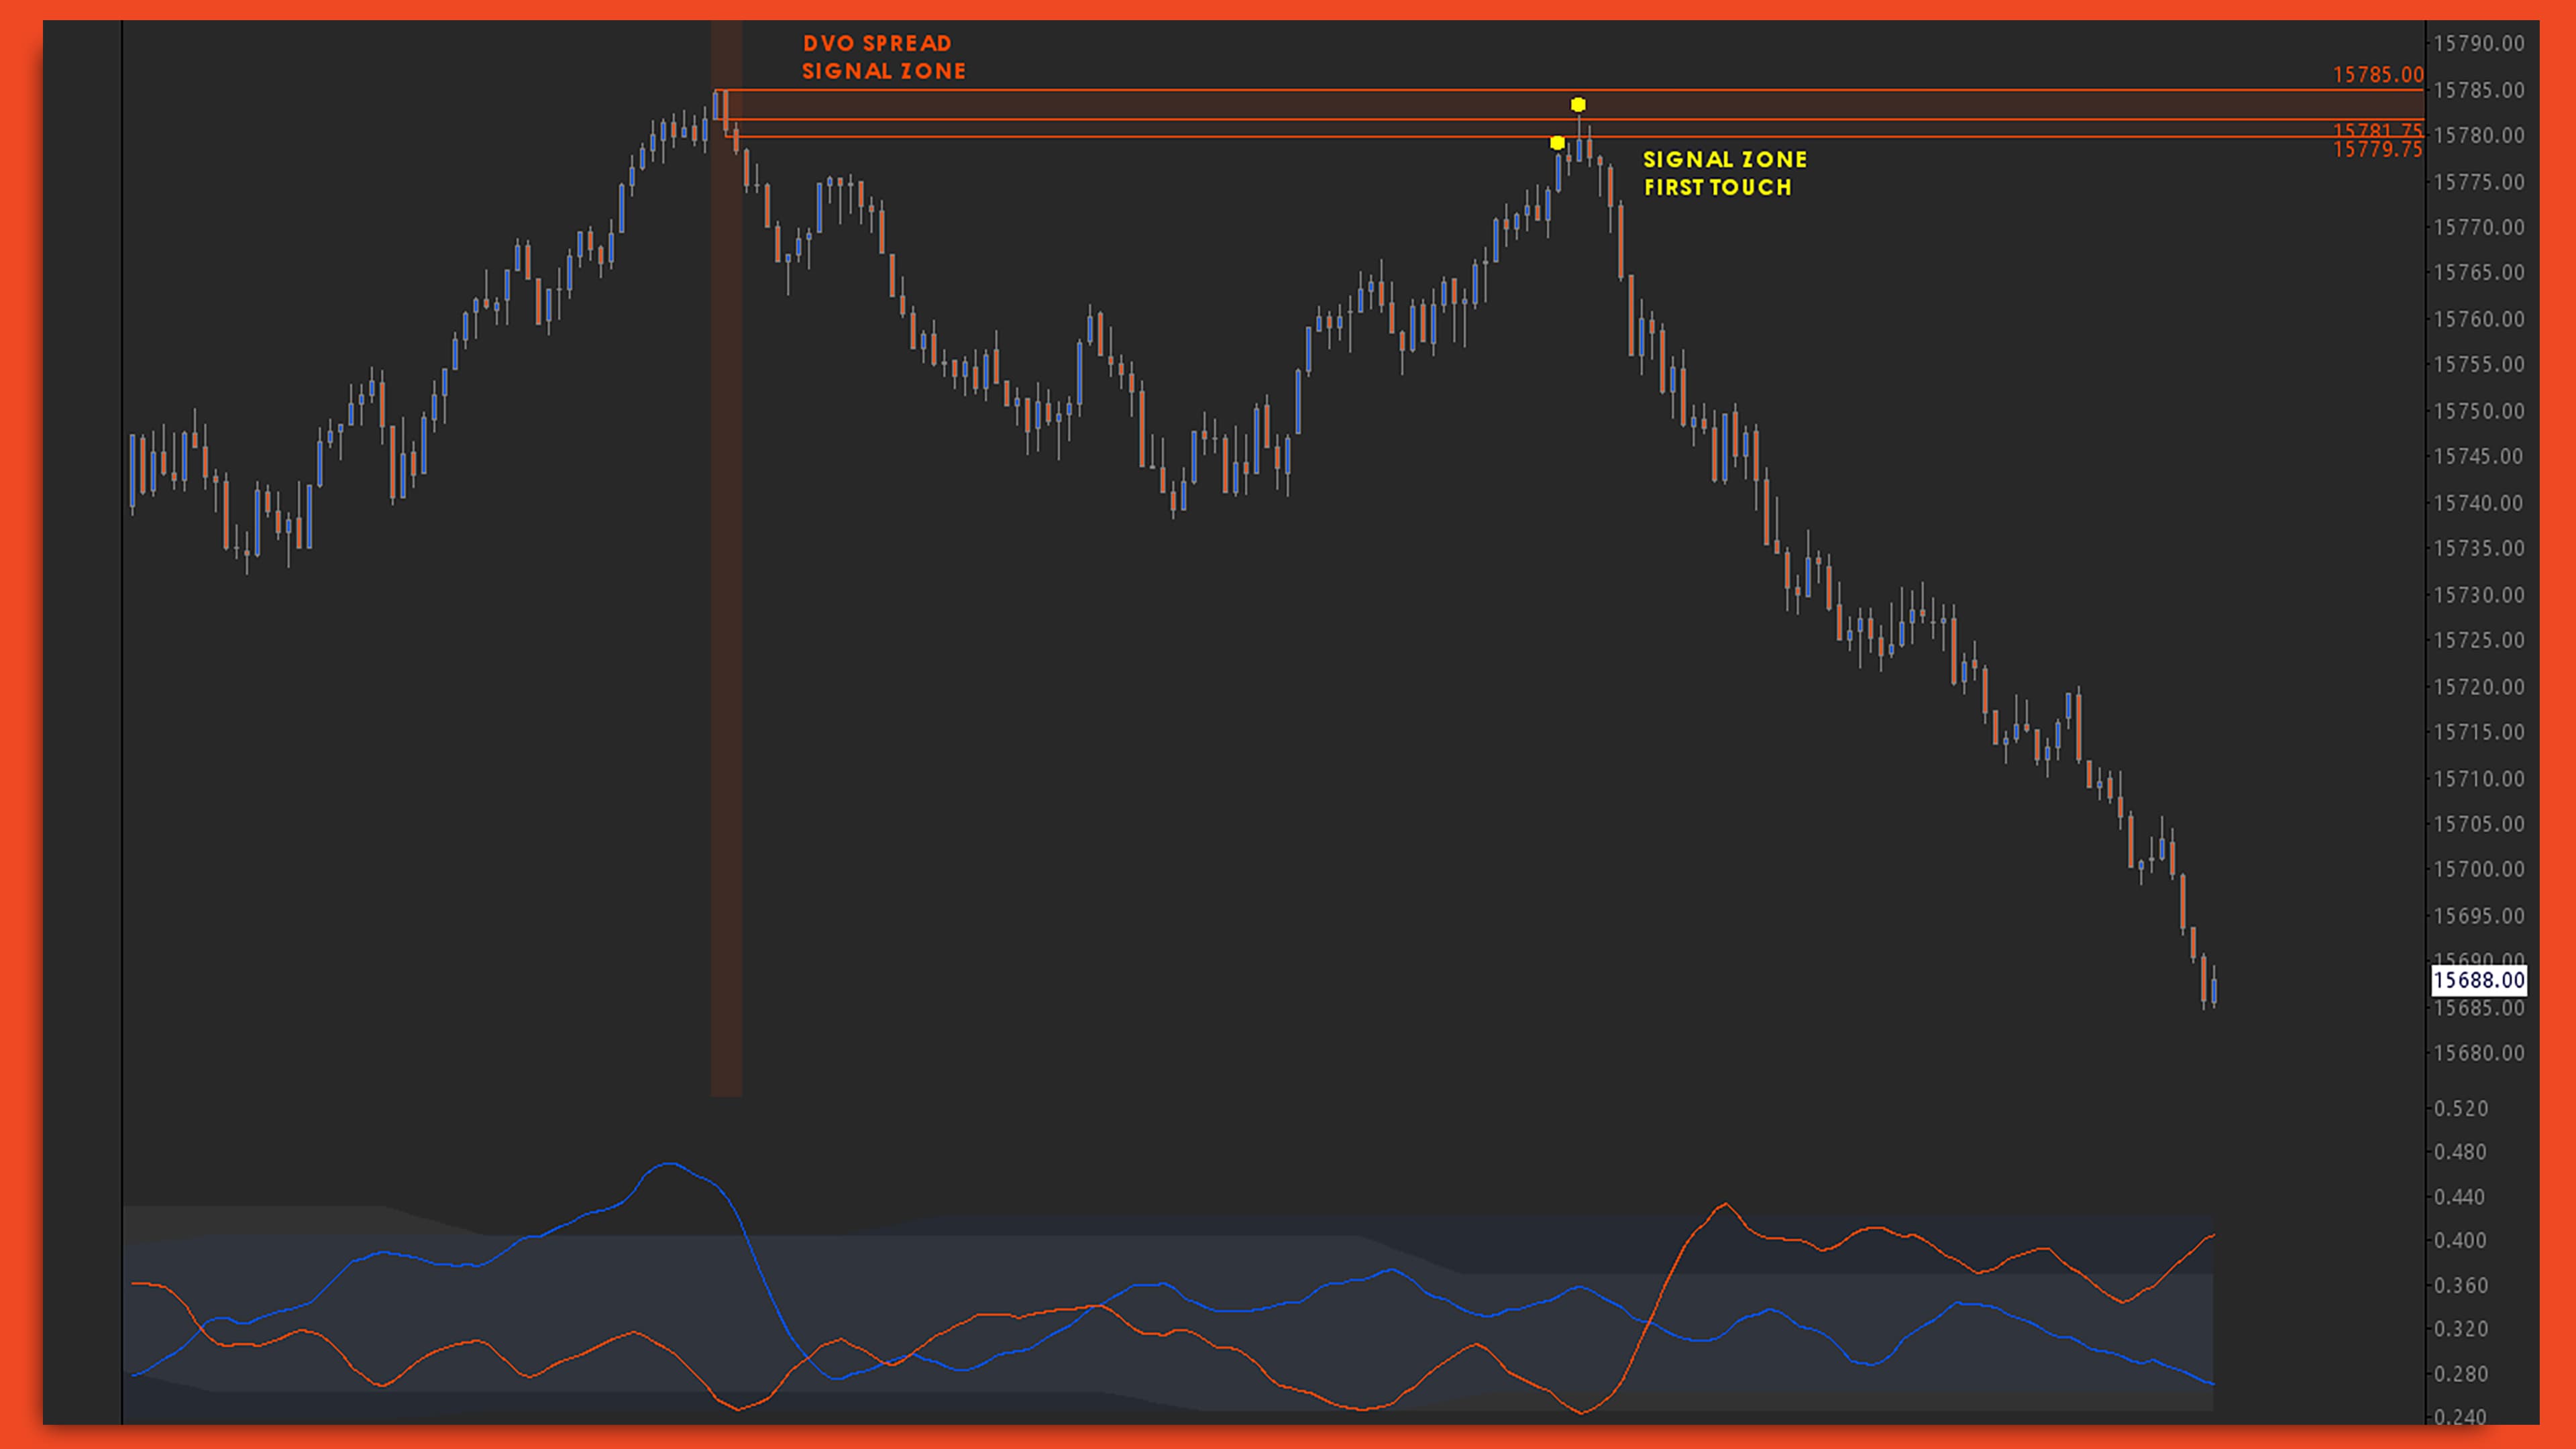
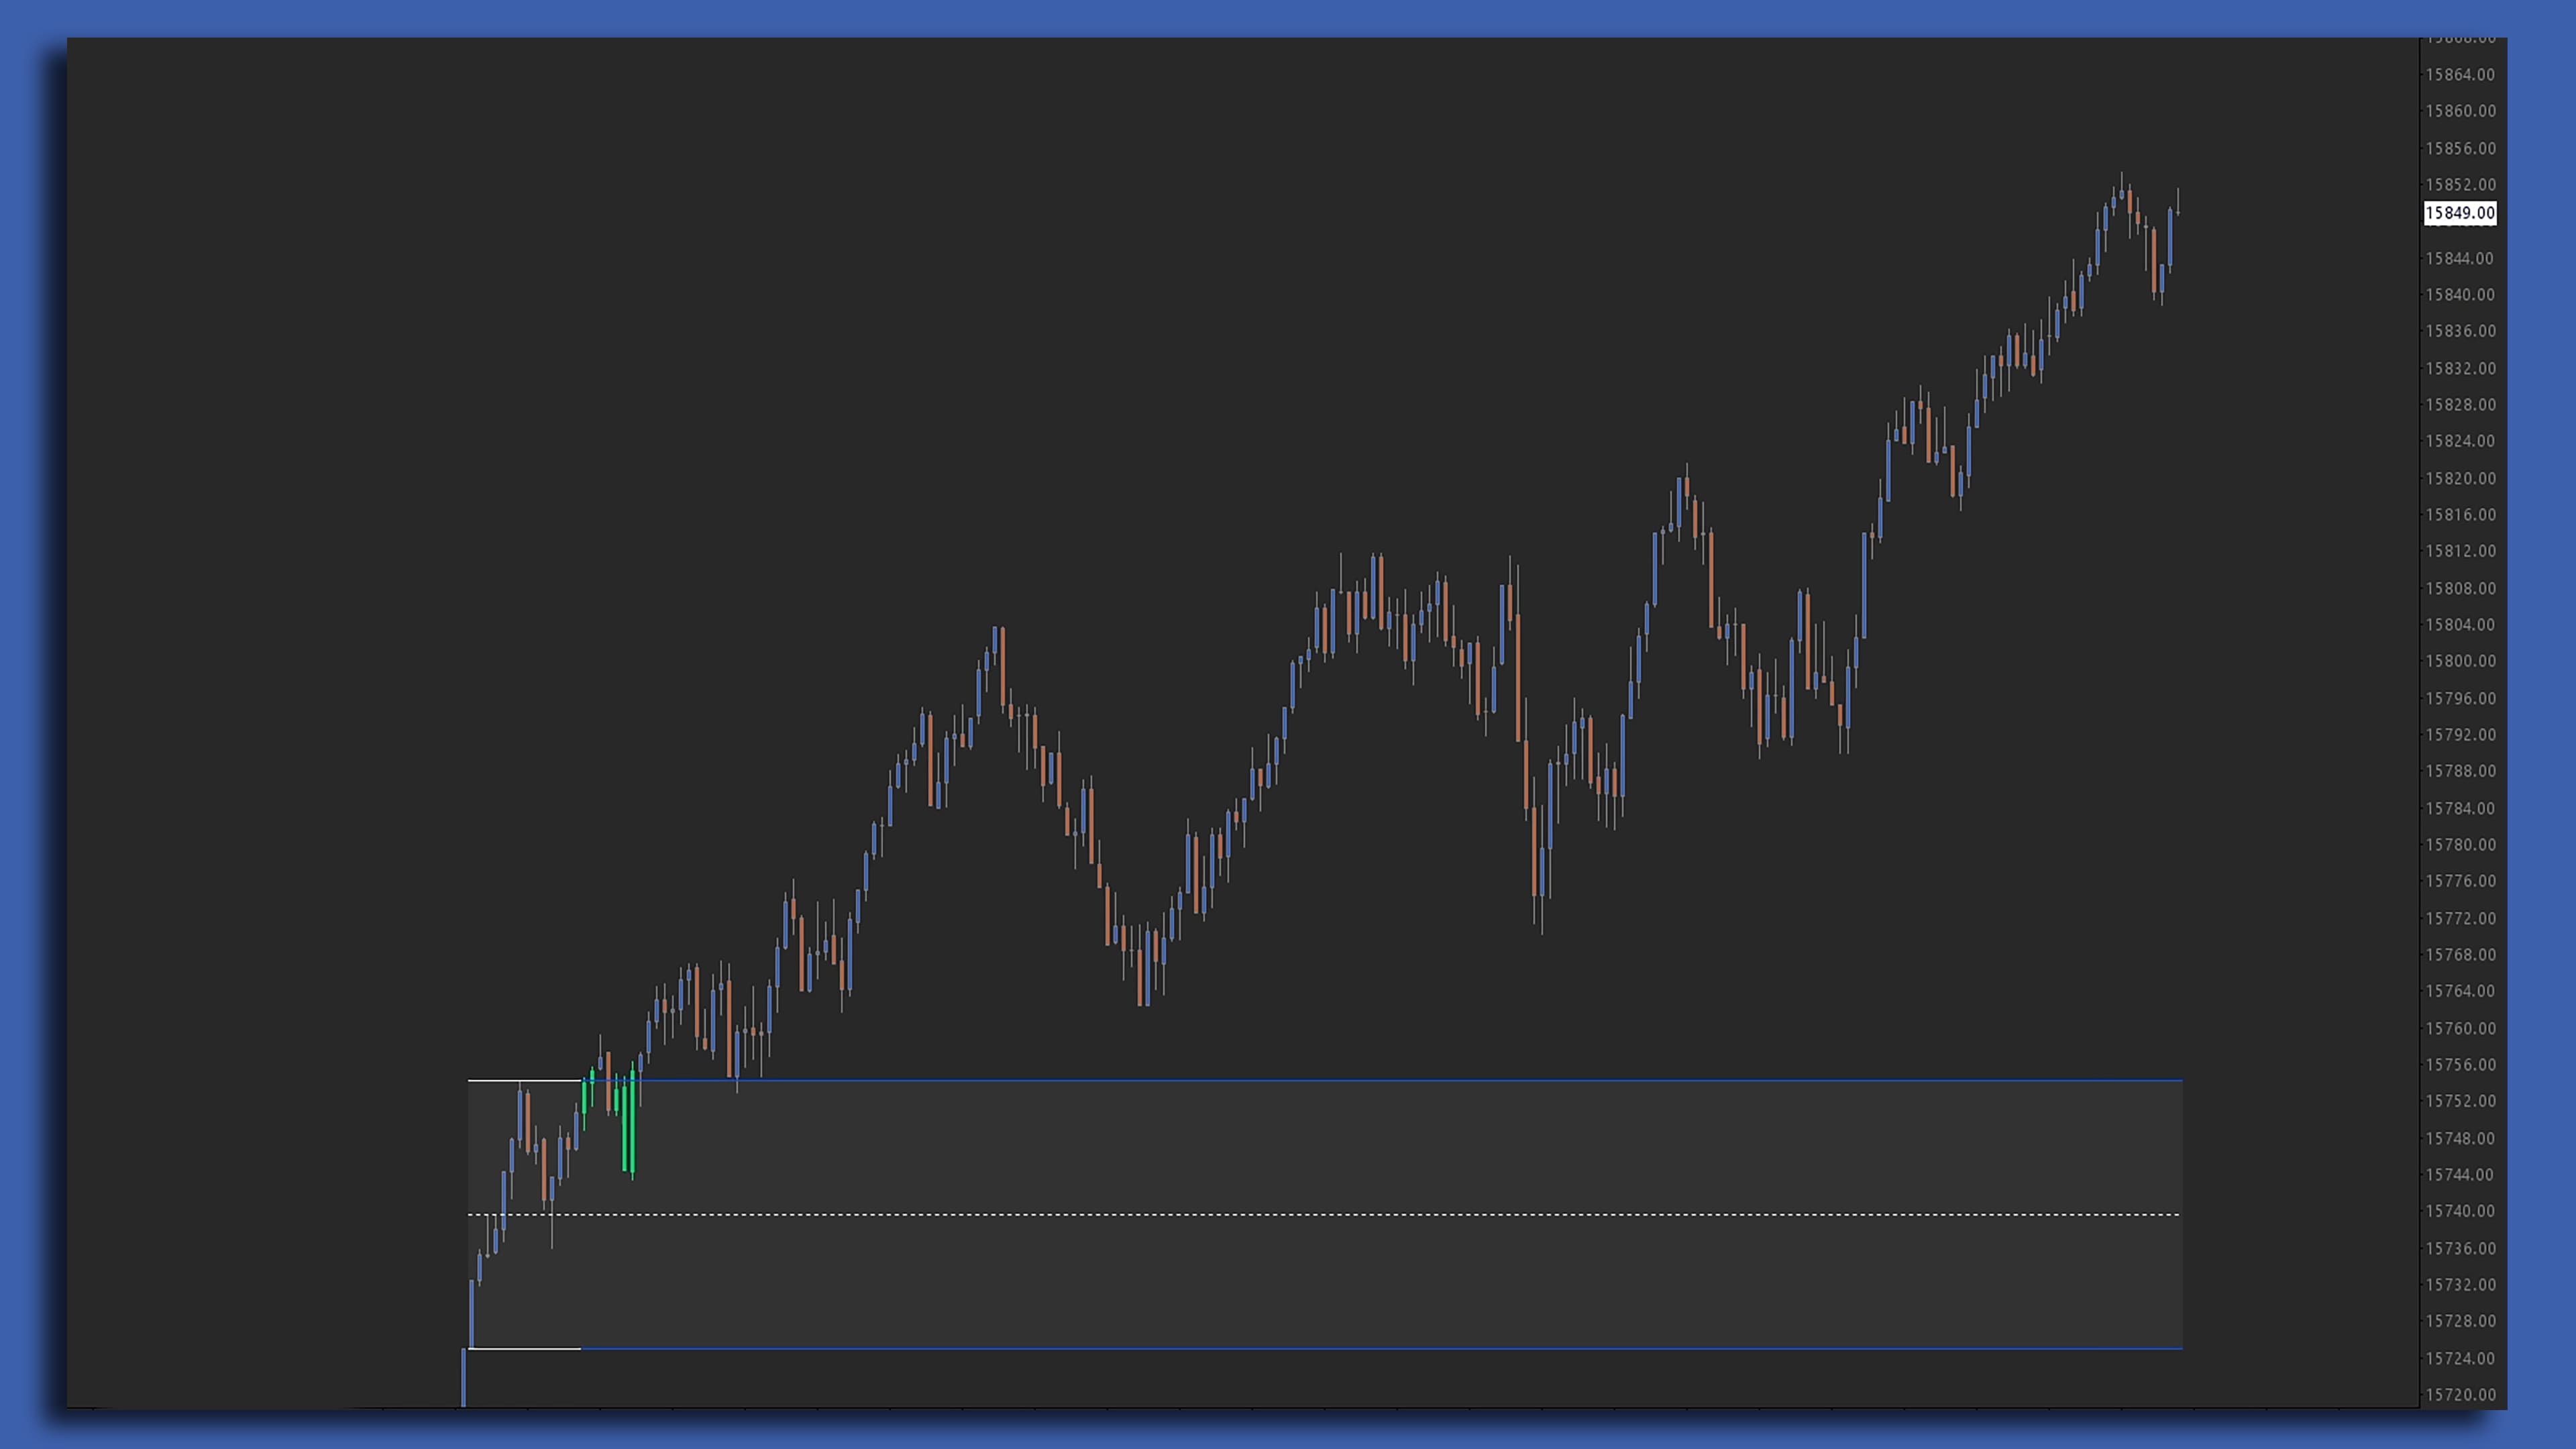
Signal Zones
After a trigger condition is met, automatically draw a zone around any signal bar or combination of subgraphs to monitor the area for a retest. Featuring a 'First Touch' of the zone subgraph, Signal Zones draws and removes custom zones from your charts based on selected settings and conditions.
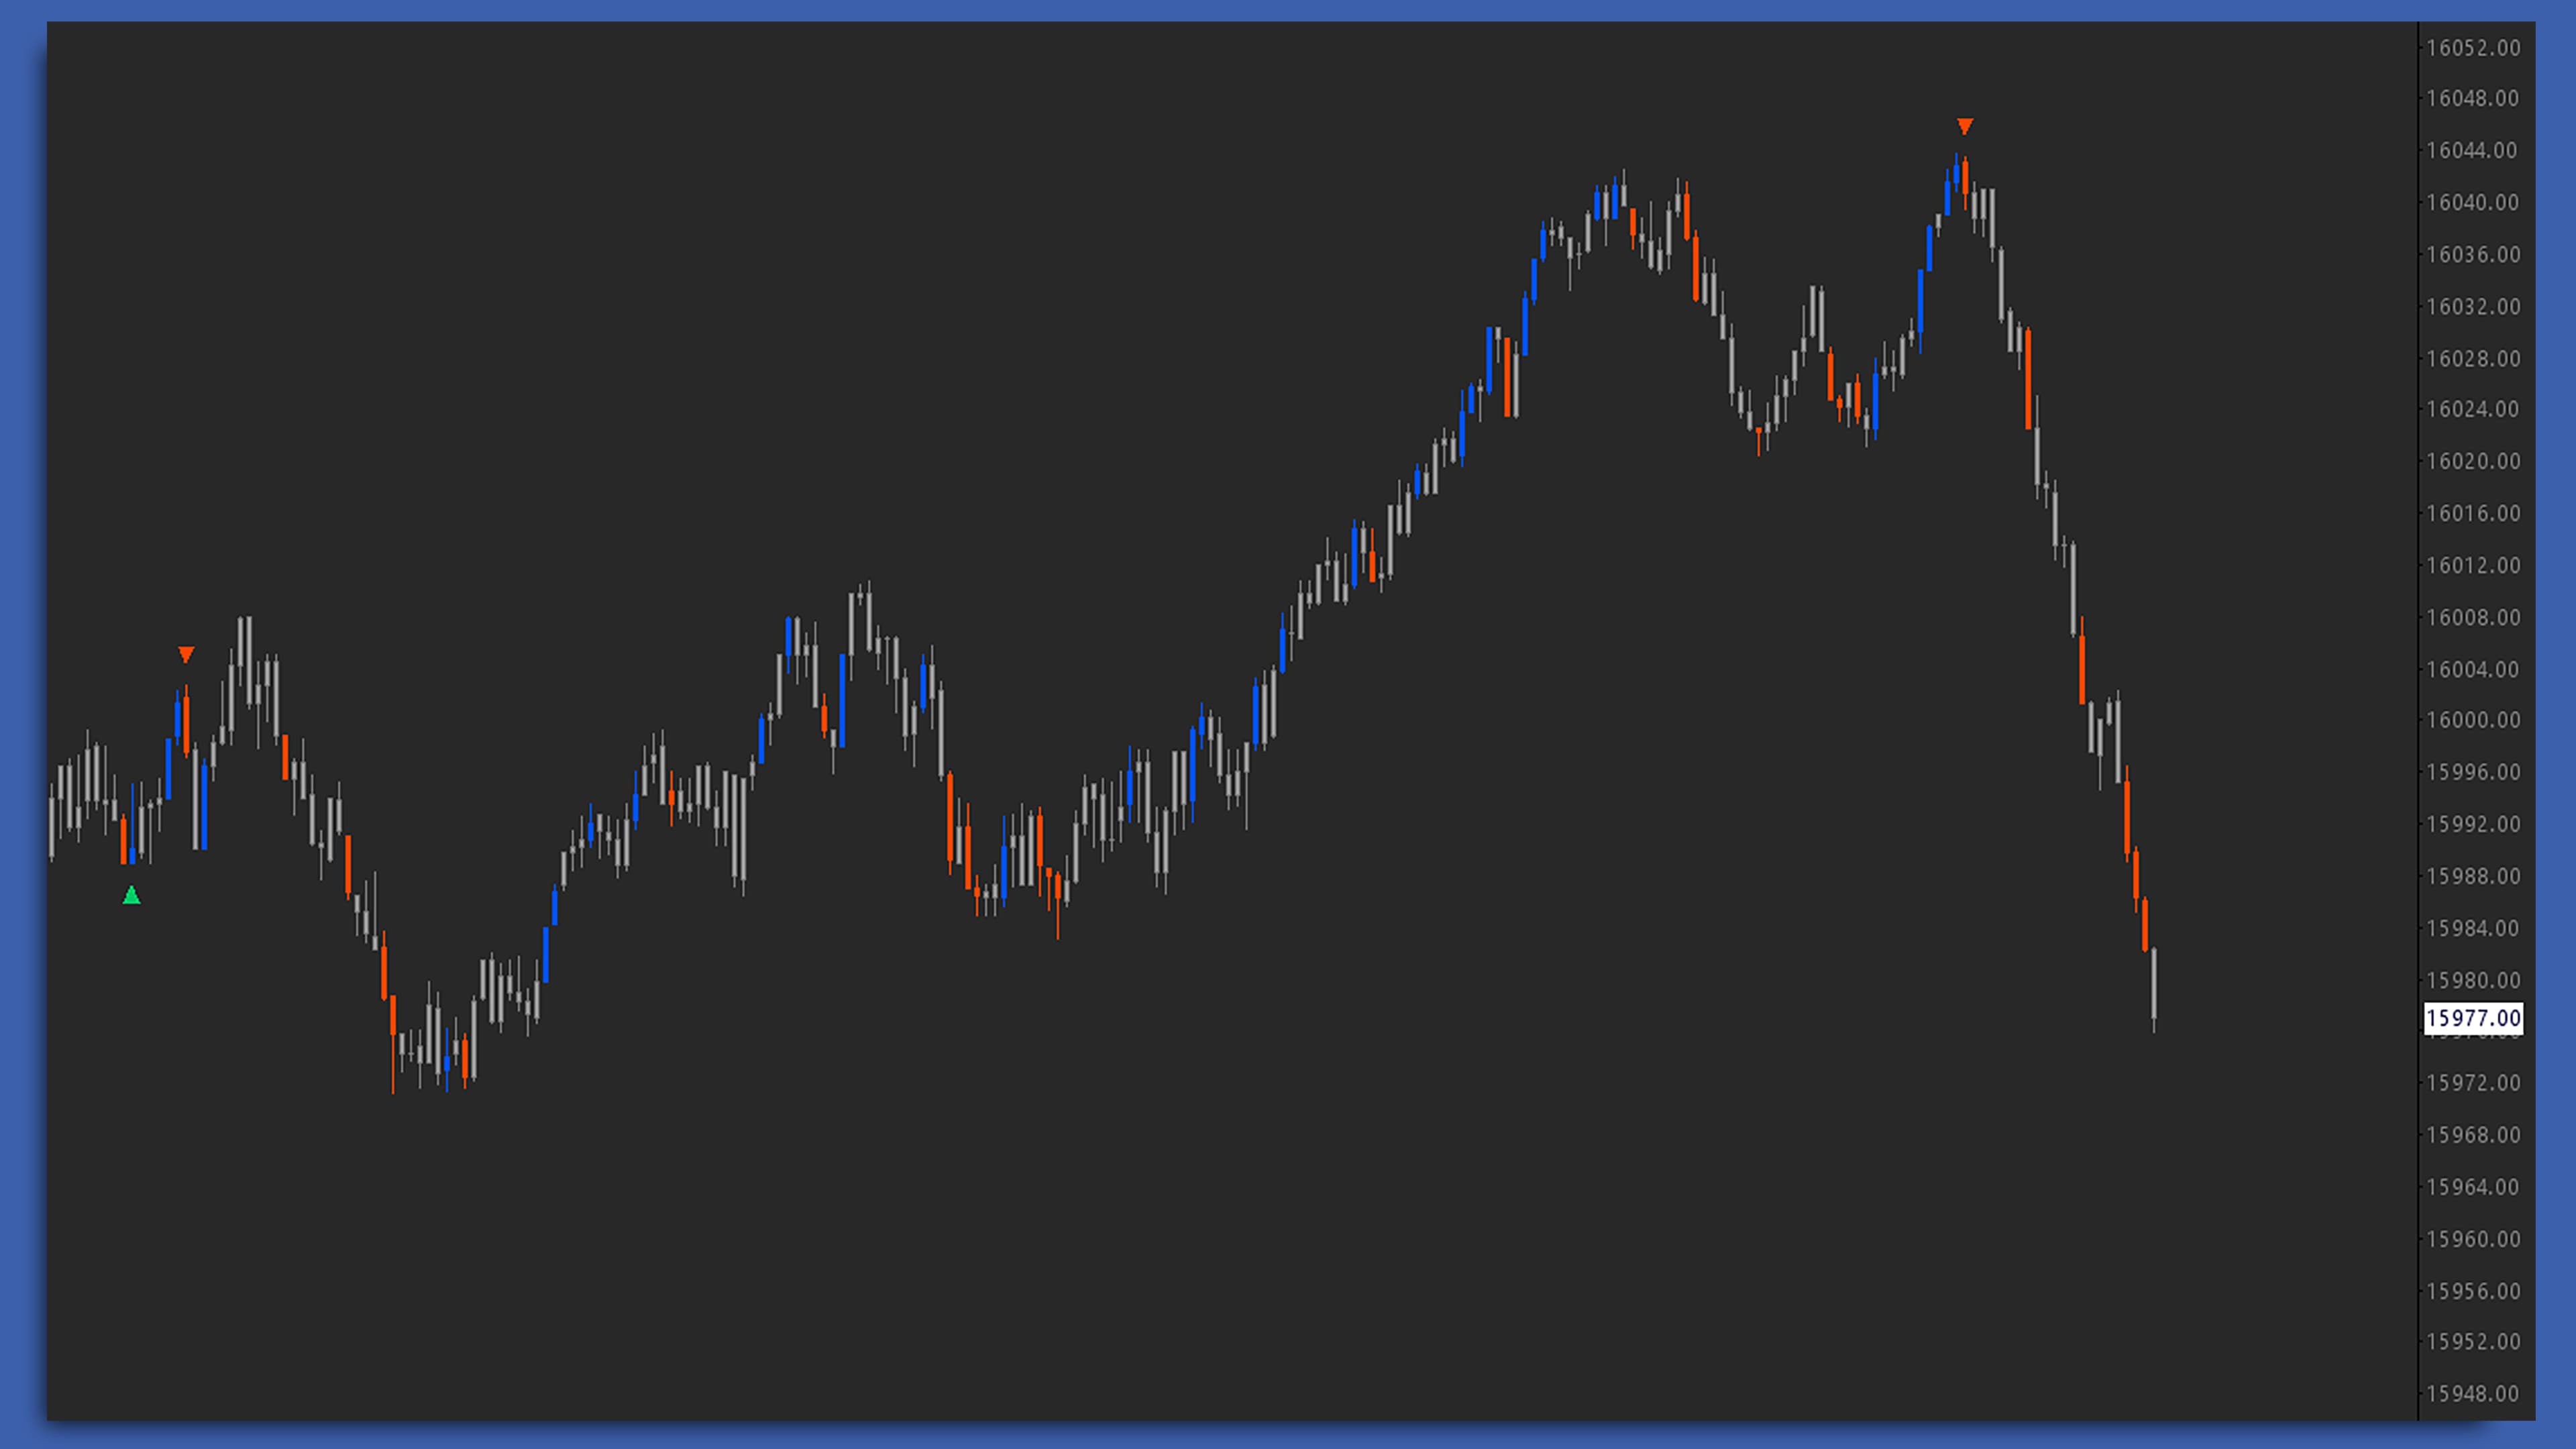
Stoprun Reversal Bars
An adaptation to the logic behind Dynamic Delta Pivots, seeking real-time extreme aggression and looking for the potential edges of the range rather than the midpoint. Stoprun Reversal Bars locates potentially exhaustive moves – typical of stop-run activity – and thus provides a short-term reversion signal.
Basic studies included with Pro
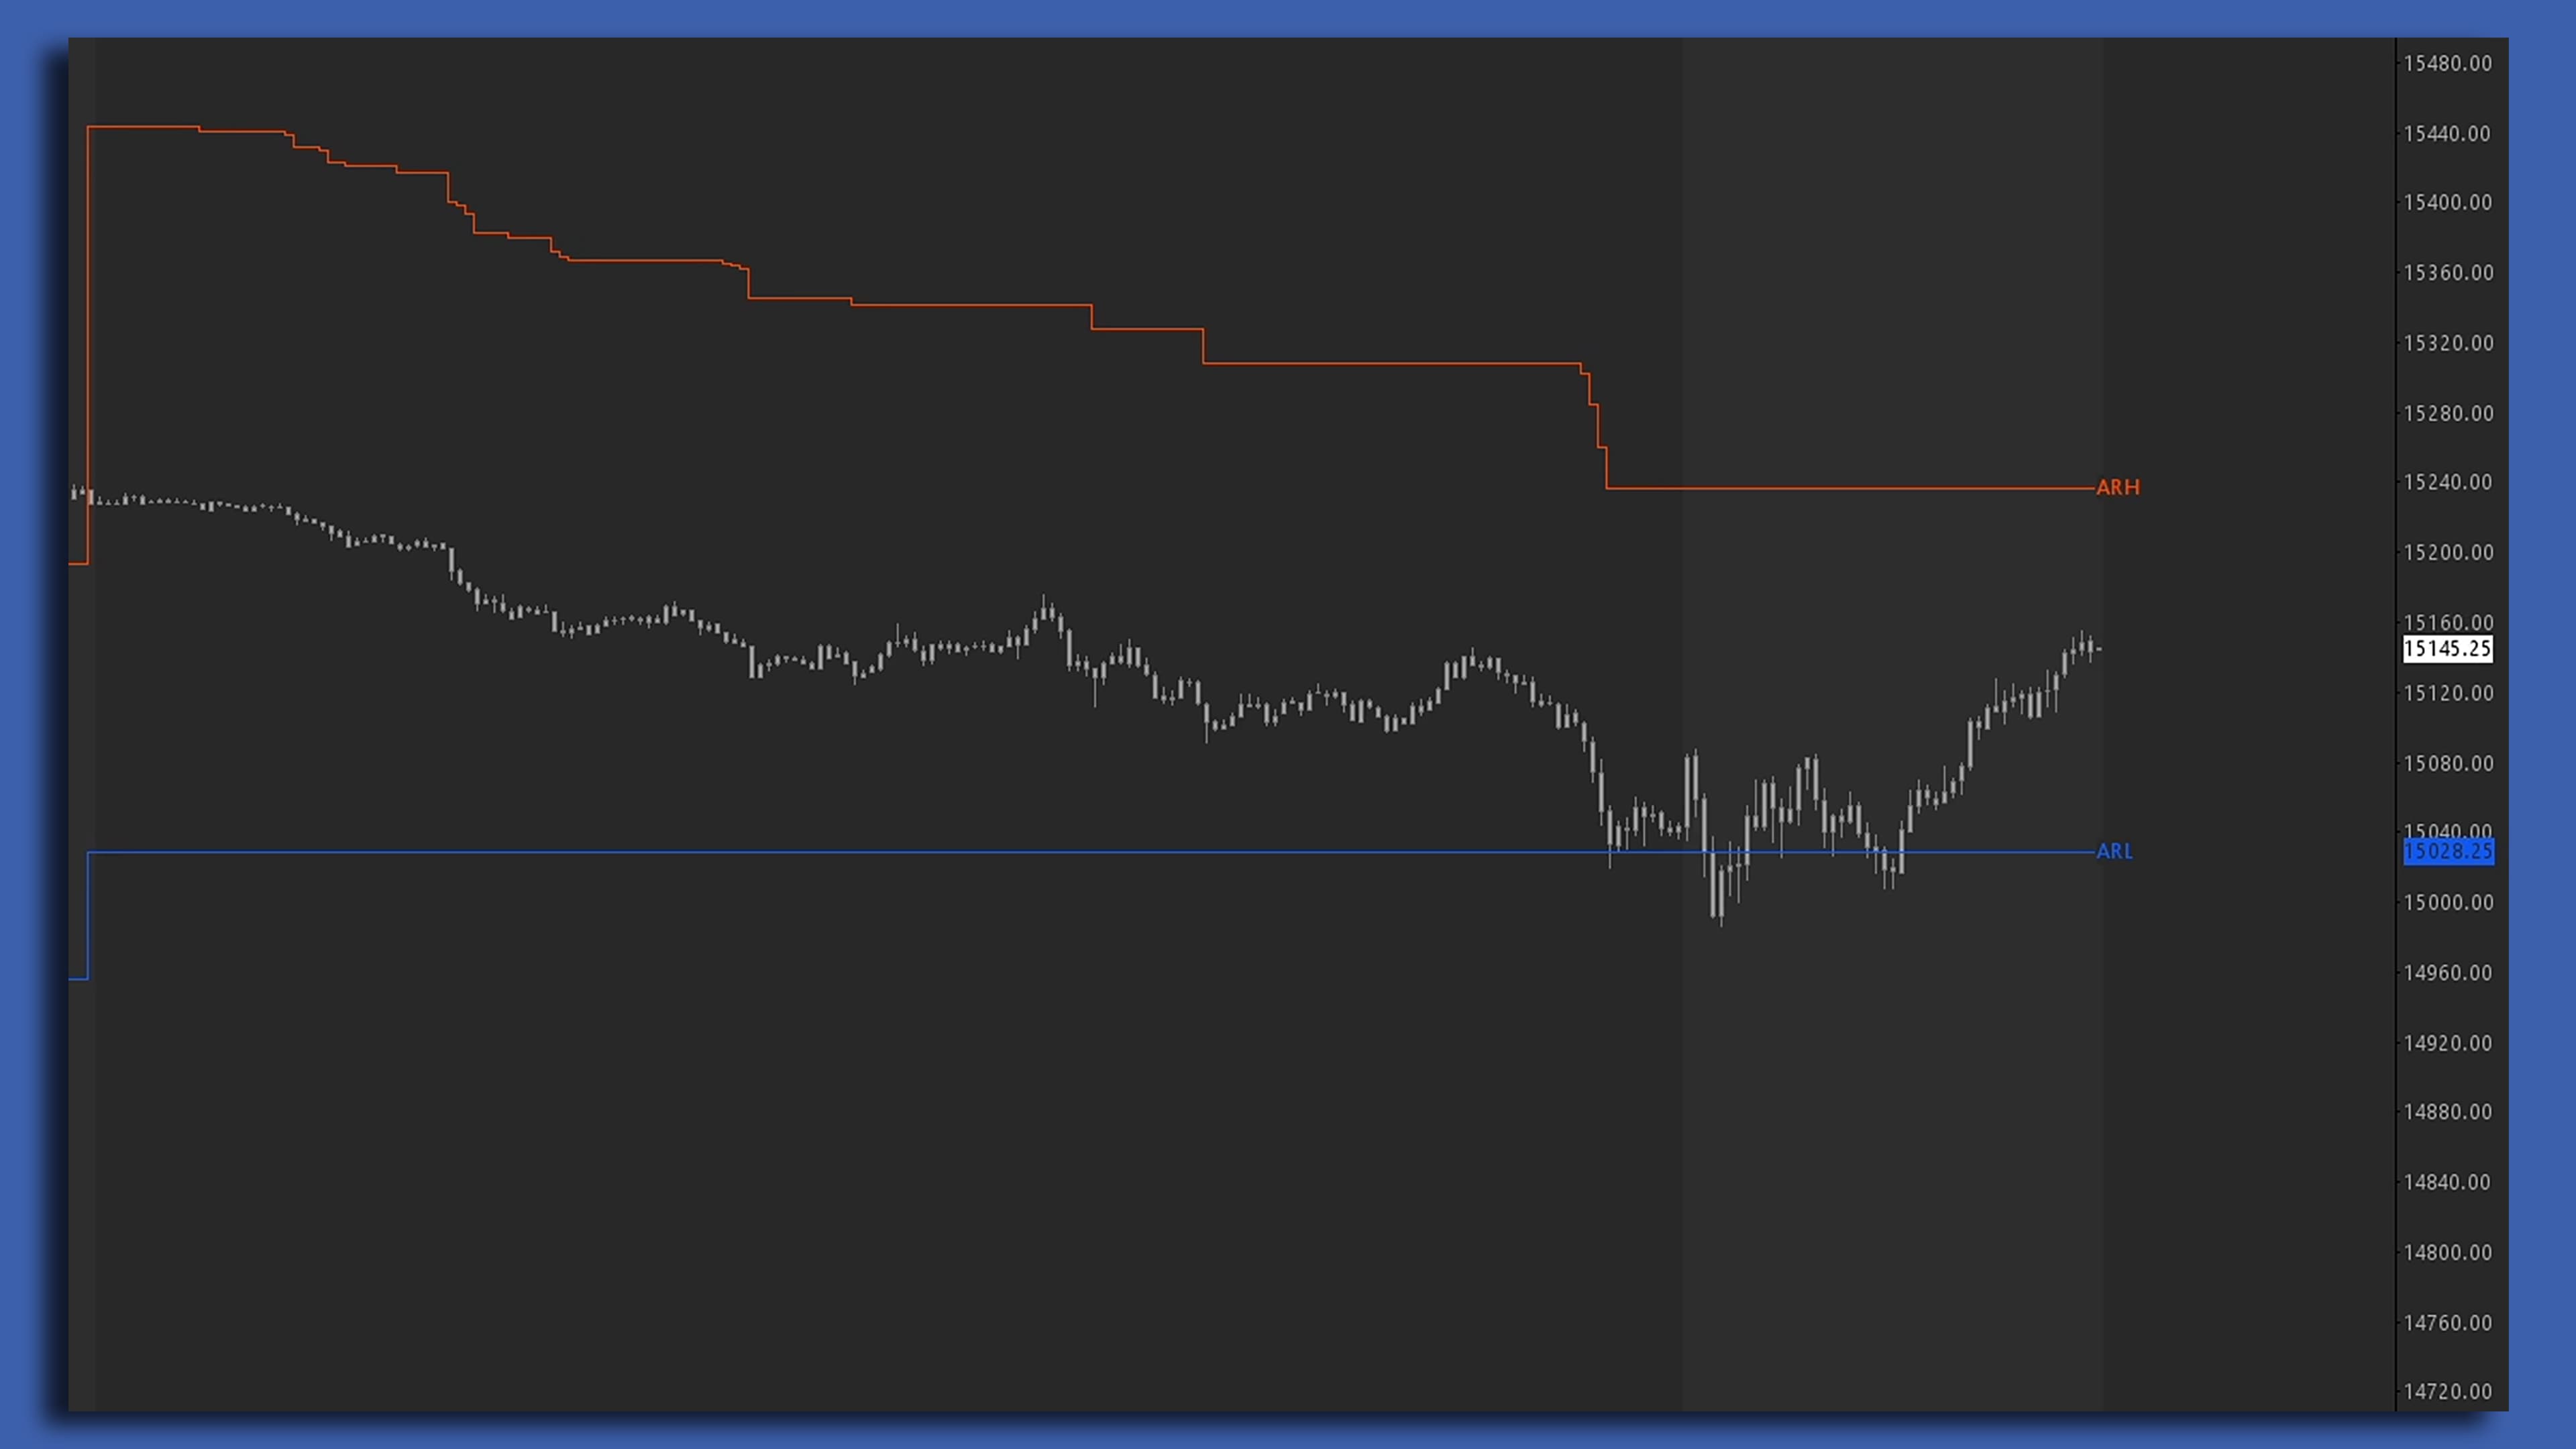
Adaptive Range Extremes
Designed to provide a perspective on the remaining daily range based on the current session’s price fluctuations. The Adaptive Range Extremes study adjusts to both intraday and high timeframe market conditions, expanding and contacting daily as well as updating in real-time.
Bid-Offer Exhaustion
A hardcoded Signal Combo of the Stoprun Reversal Bars and the Delta-Volume Oscillator. Bid-Offer Exhaustion combines two methods for tracking one-sided order flow fatigue to indicate a potential reversal.
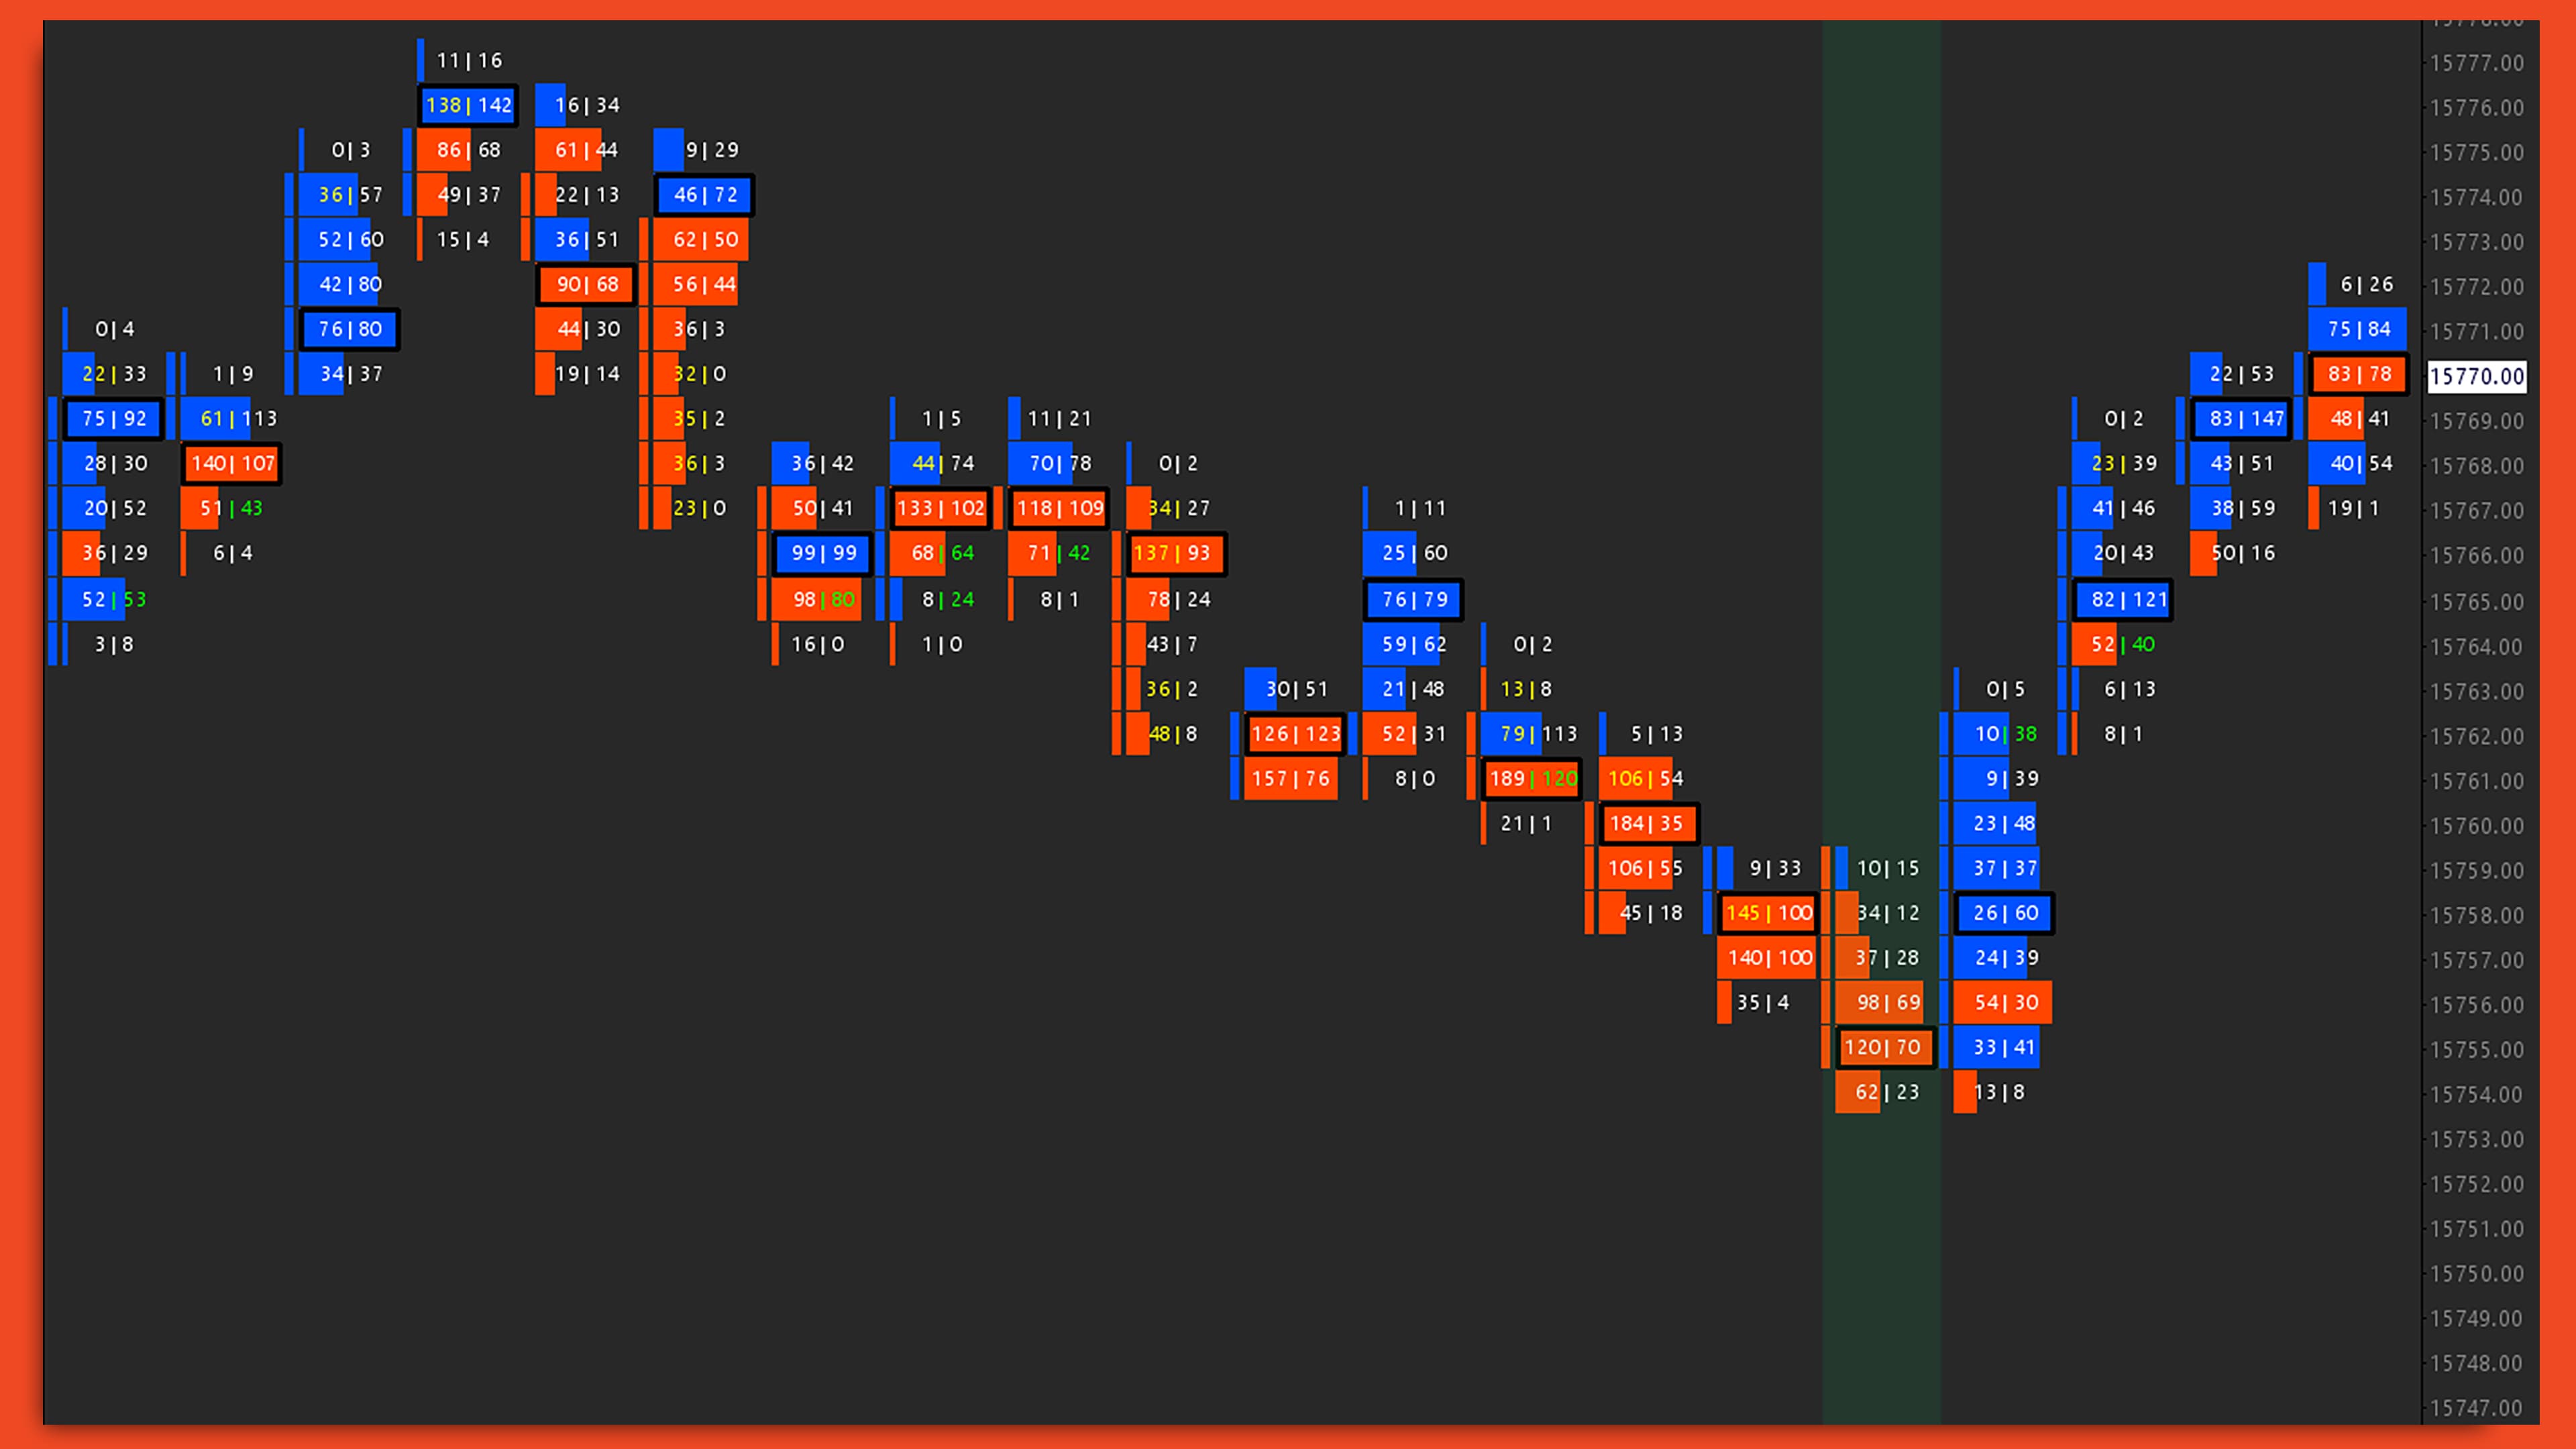
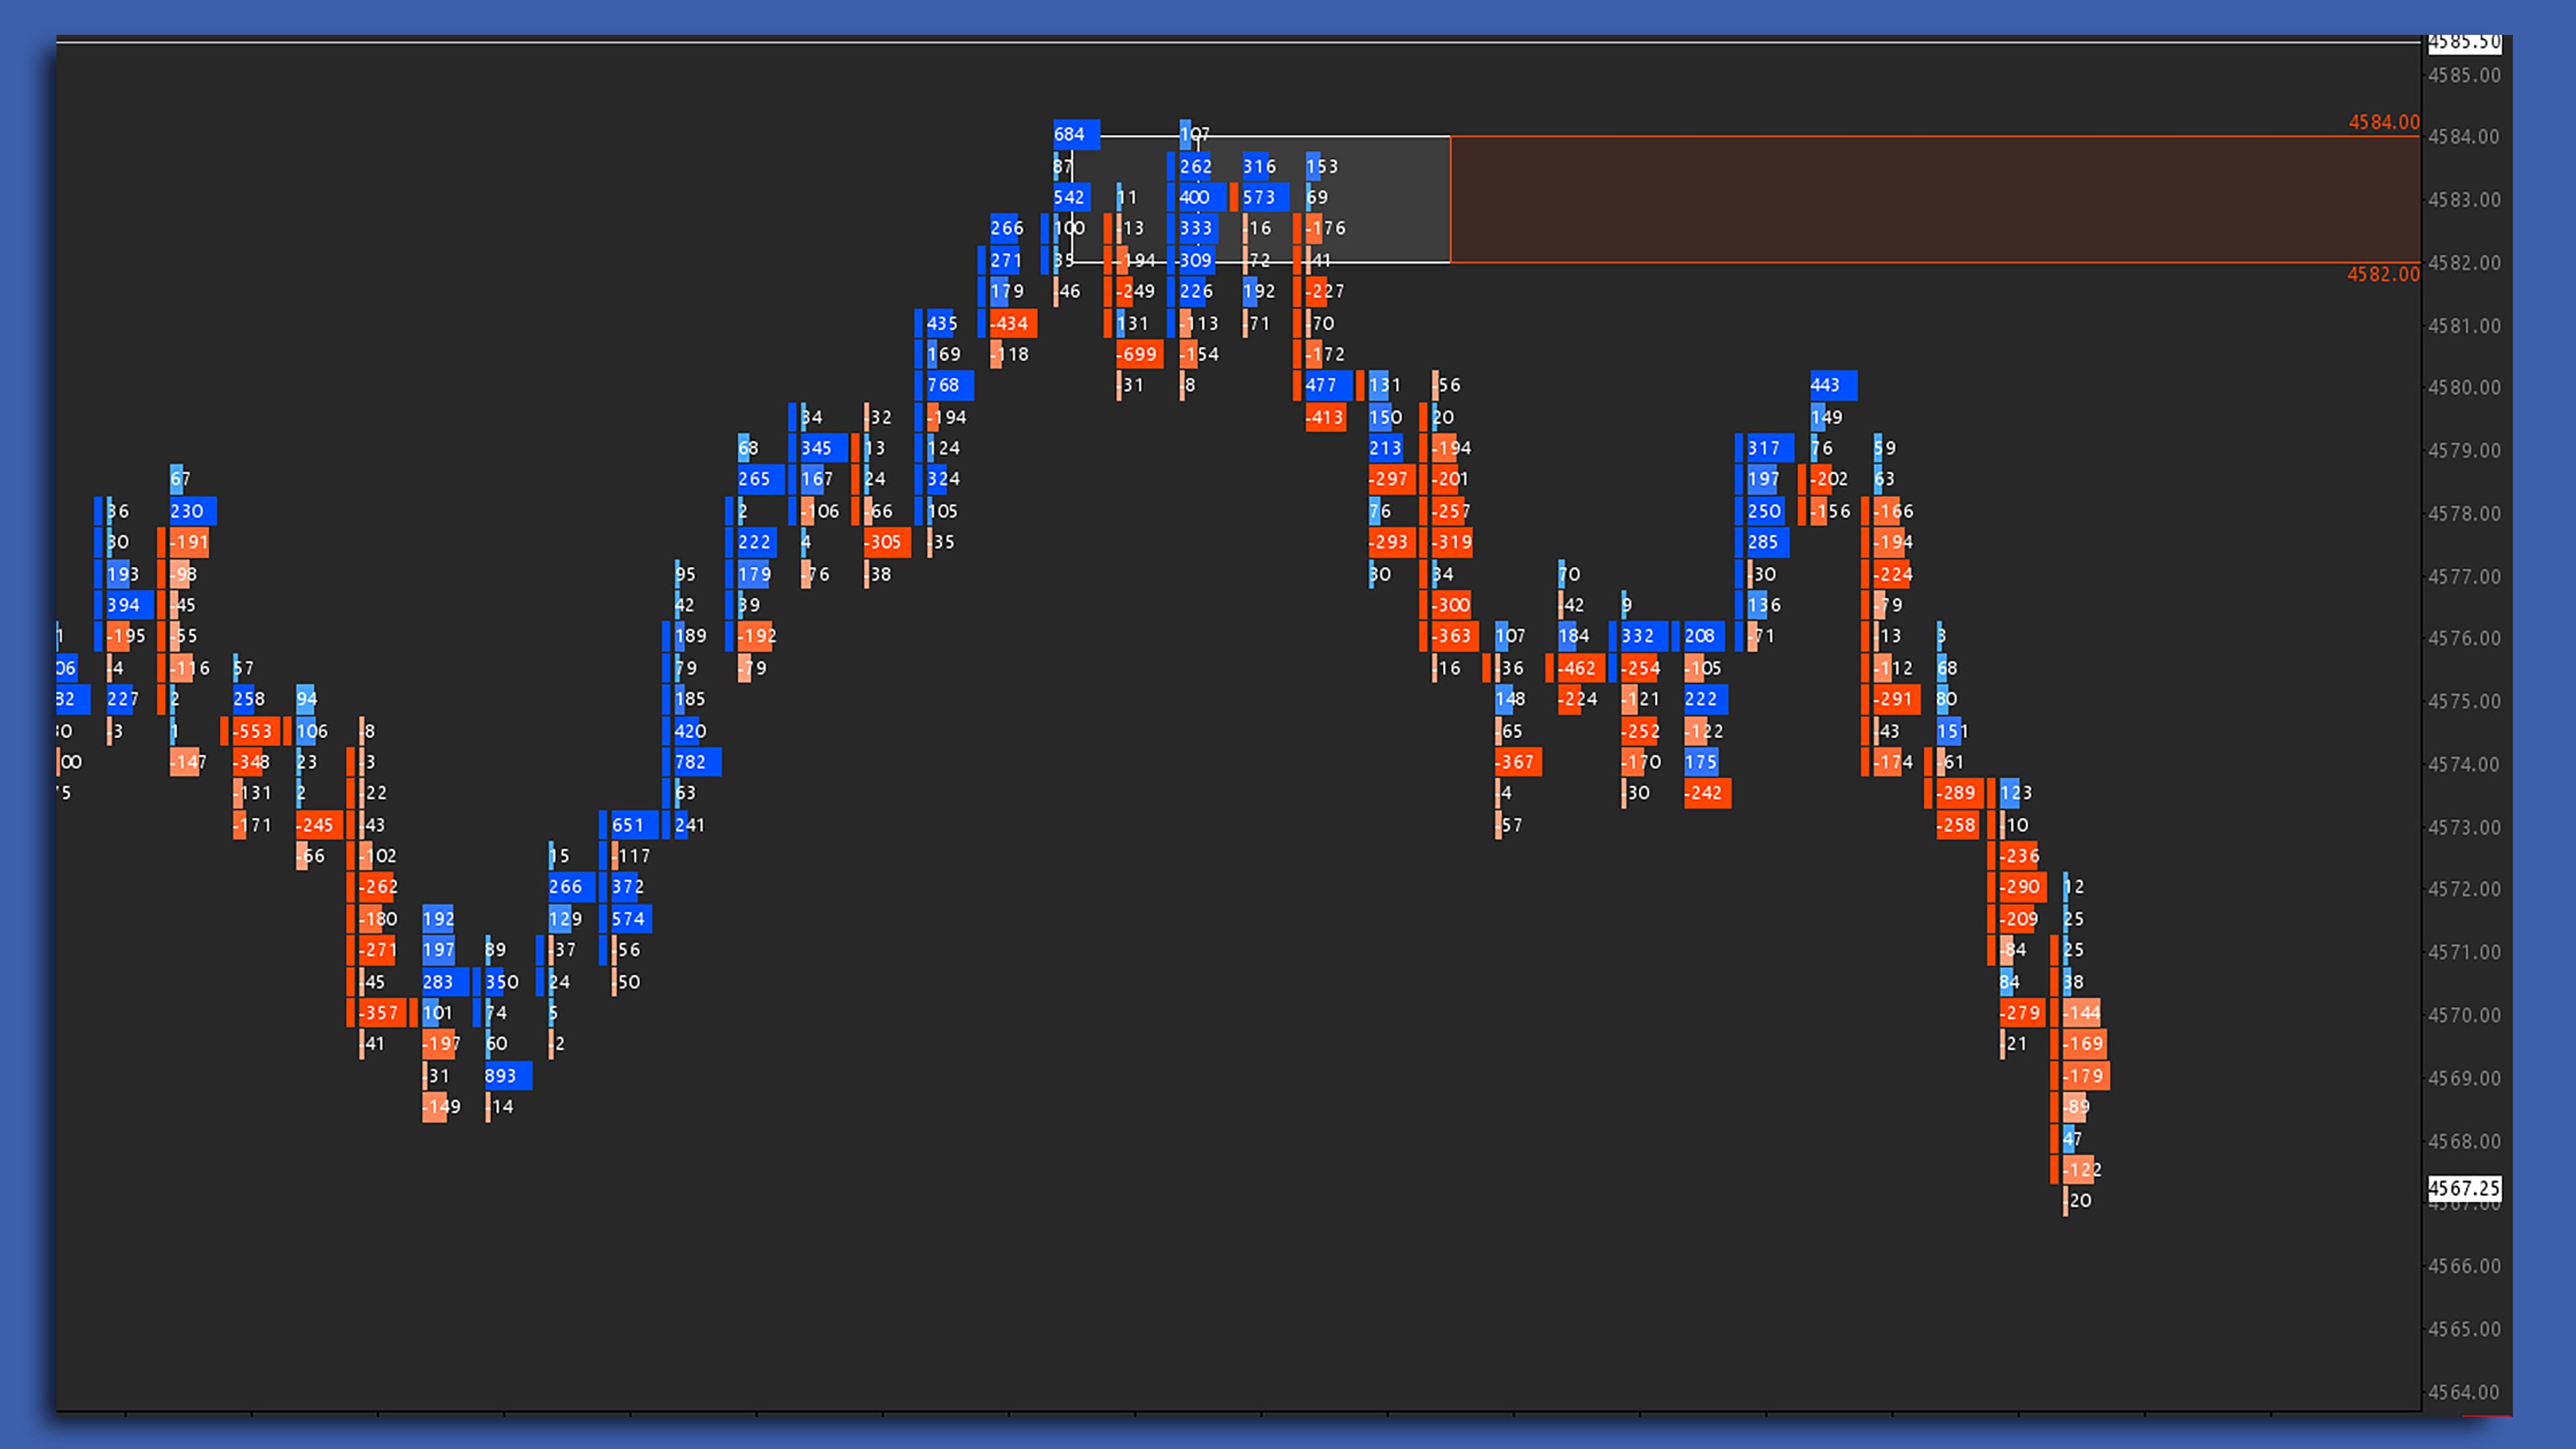
Delta Impulse
Bring the benefits of the Delta Footprint directly to your bar chart with color-coded displays. Providing clear insights into dominant Delta at Price, Delta Impulse identifies bars entirely formed by anomalous negative or positive delta.
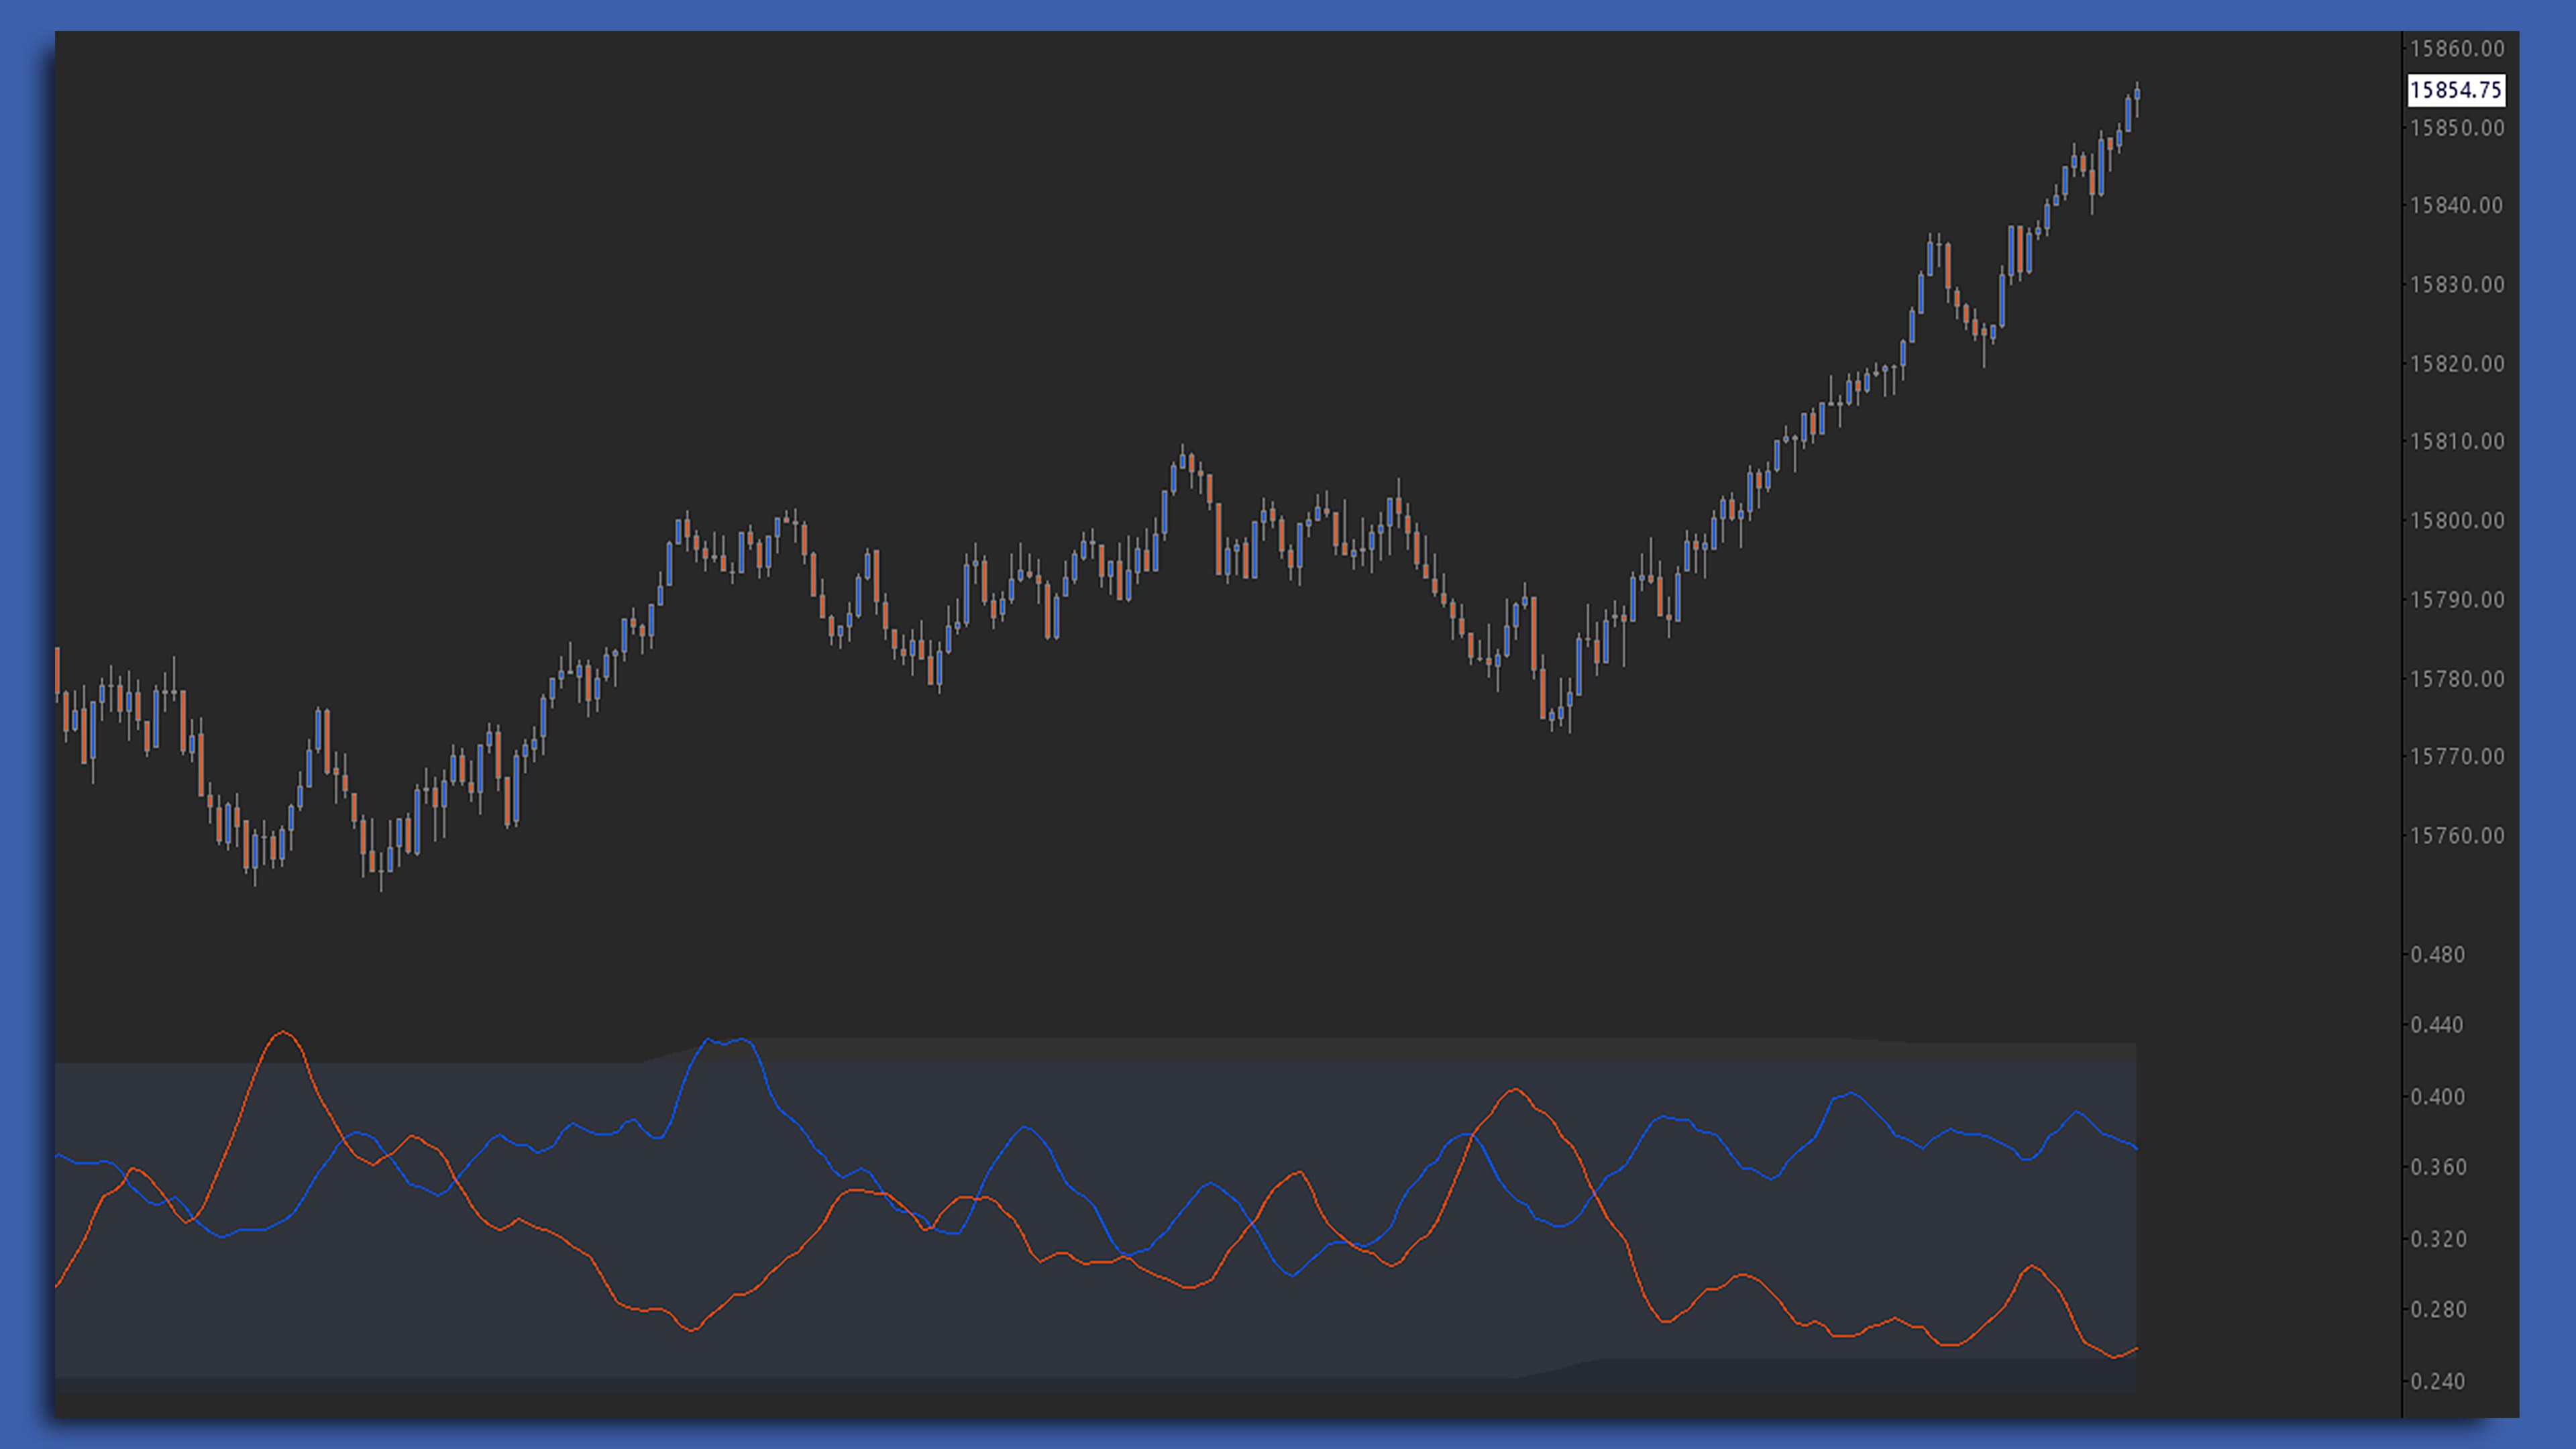
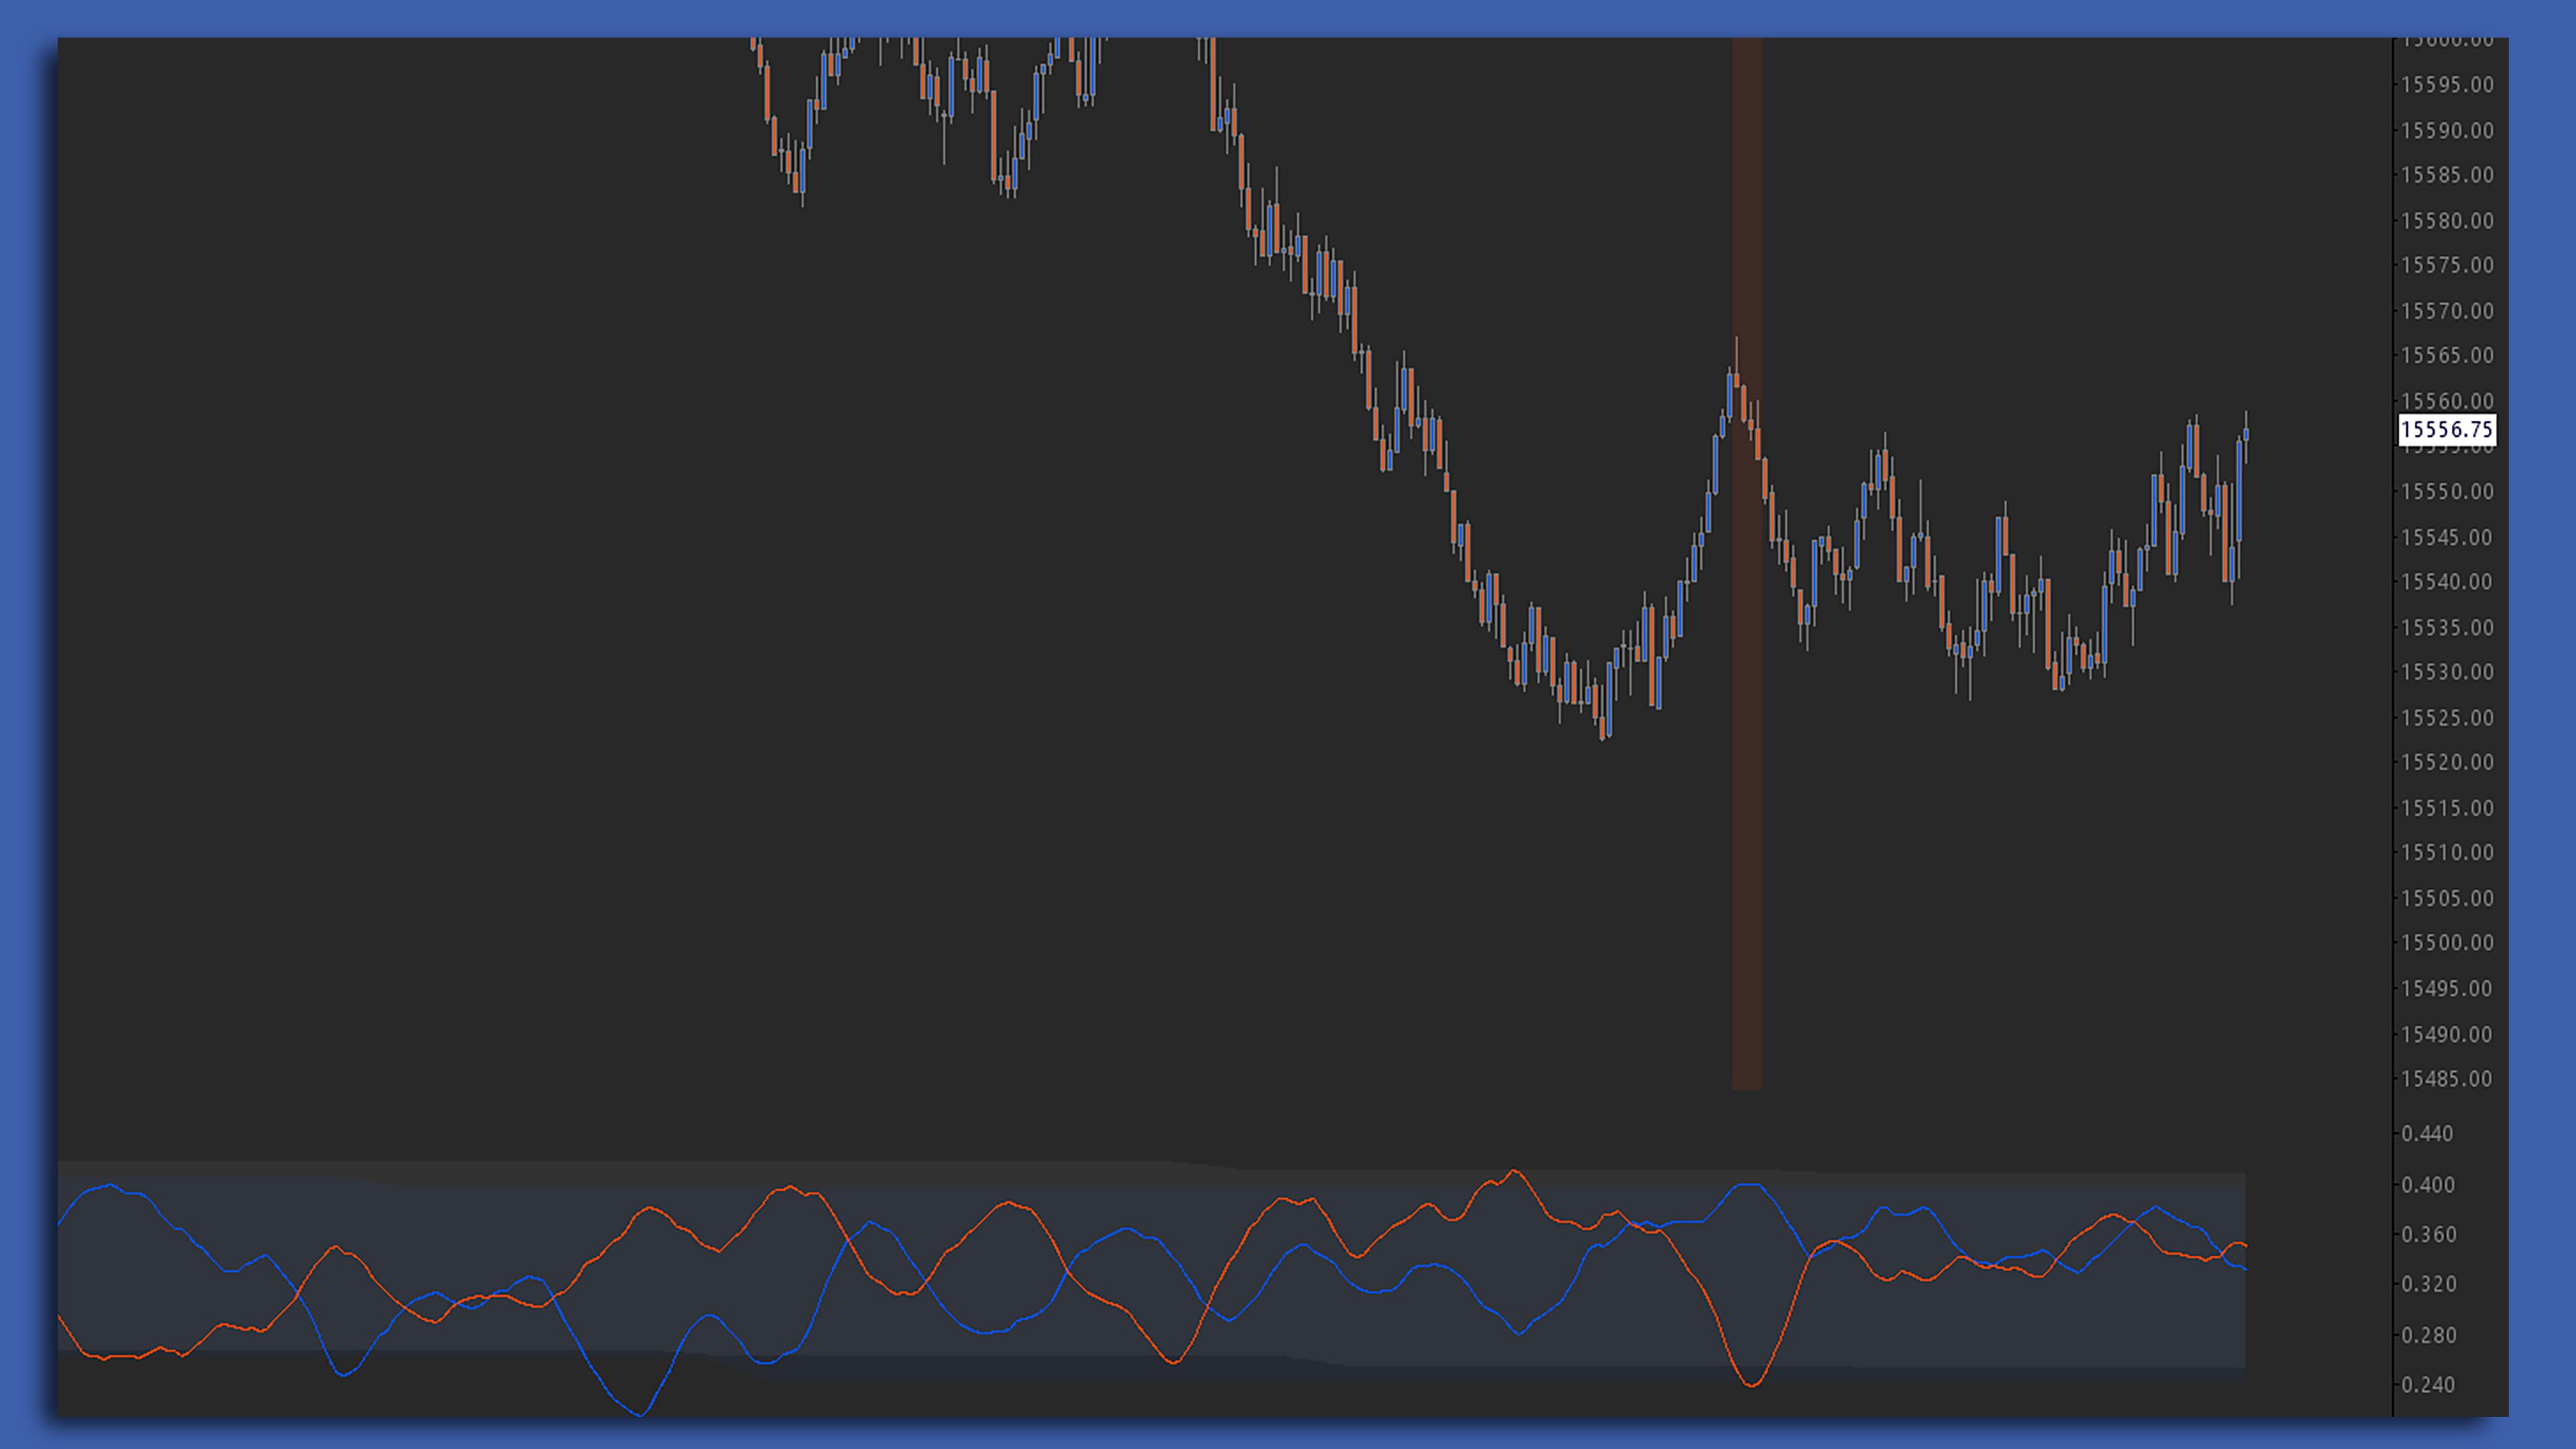
Delta-Volume Oscillator
Independently track the ratio of Bid and Offer volume relative to delta. Visualized as two oscillators, the DVO study allows traders to more effectively monitor the current strength and potential point of exhaustion for the flows coming into the market.
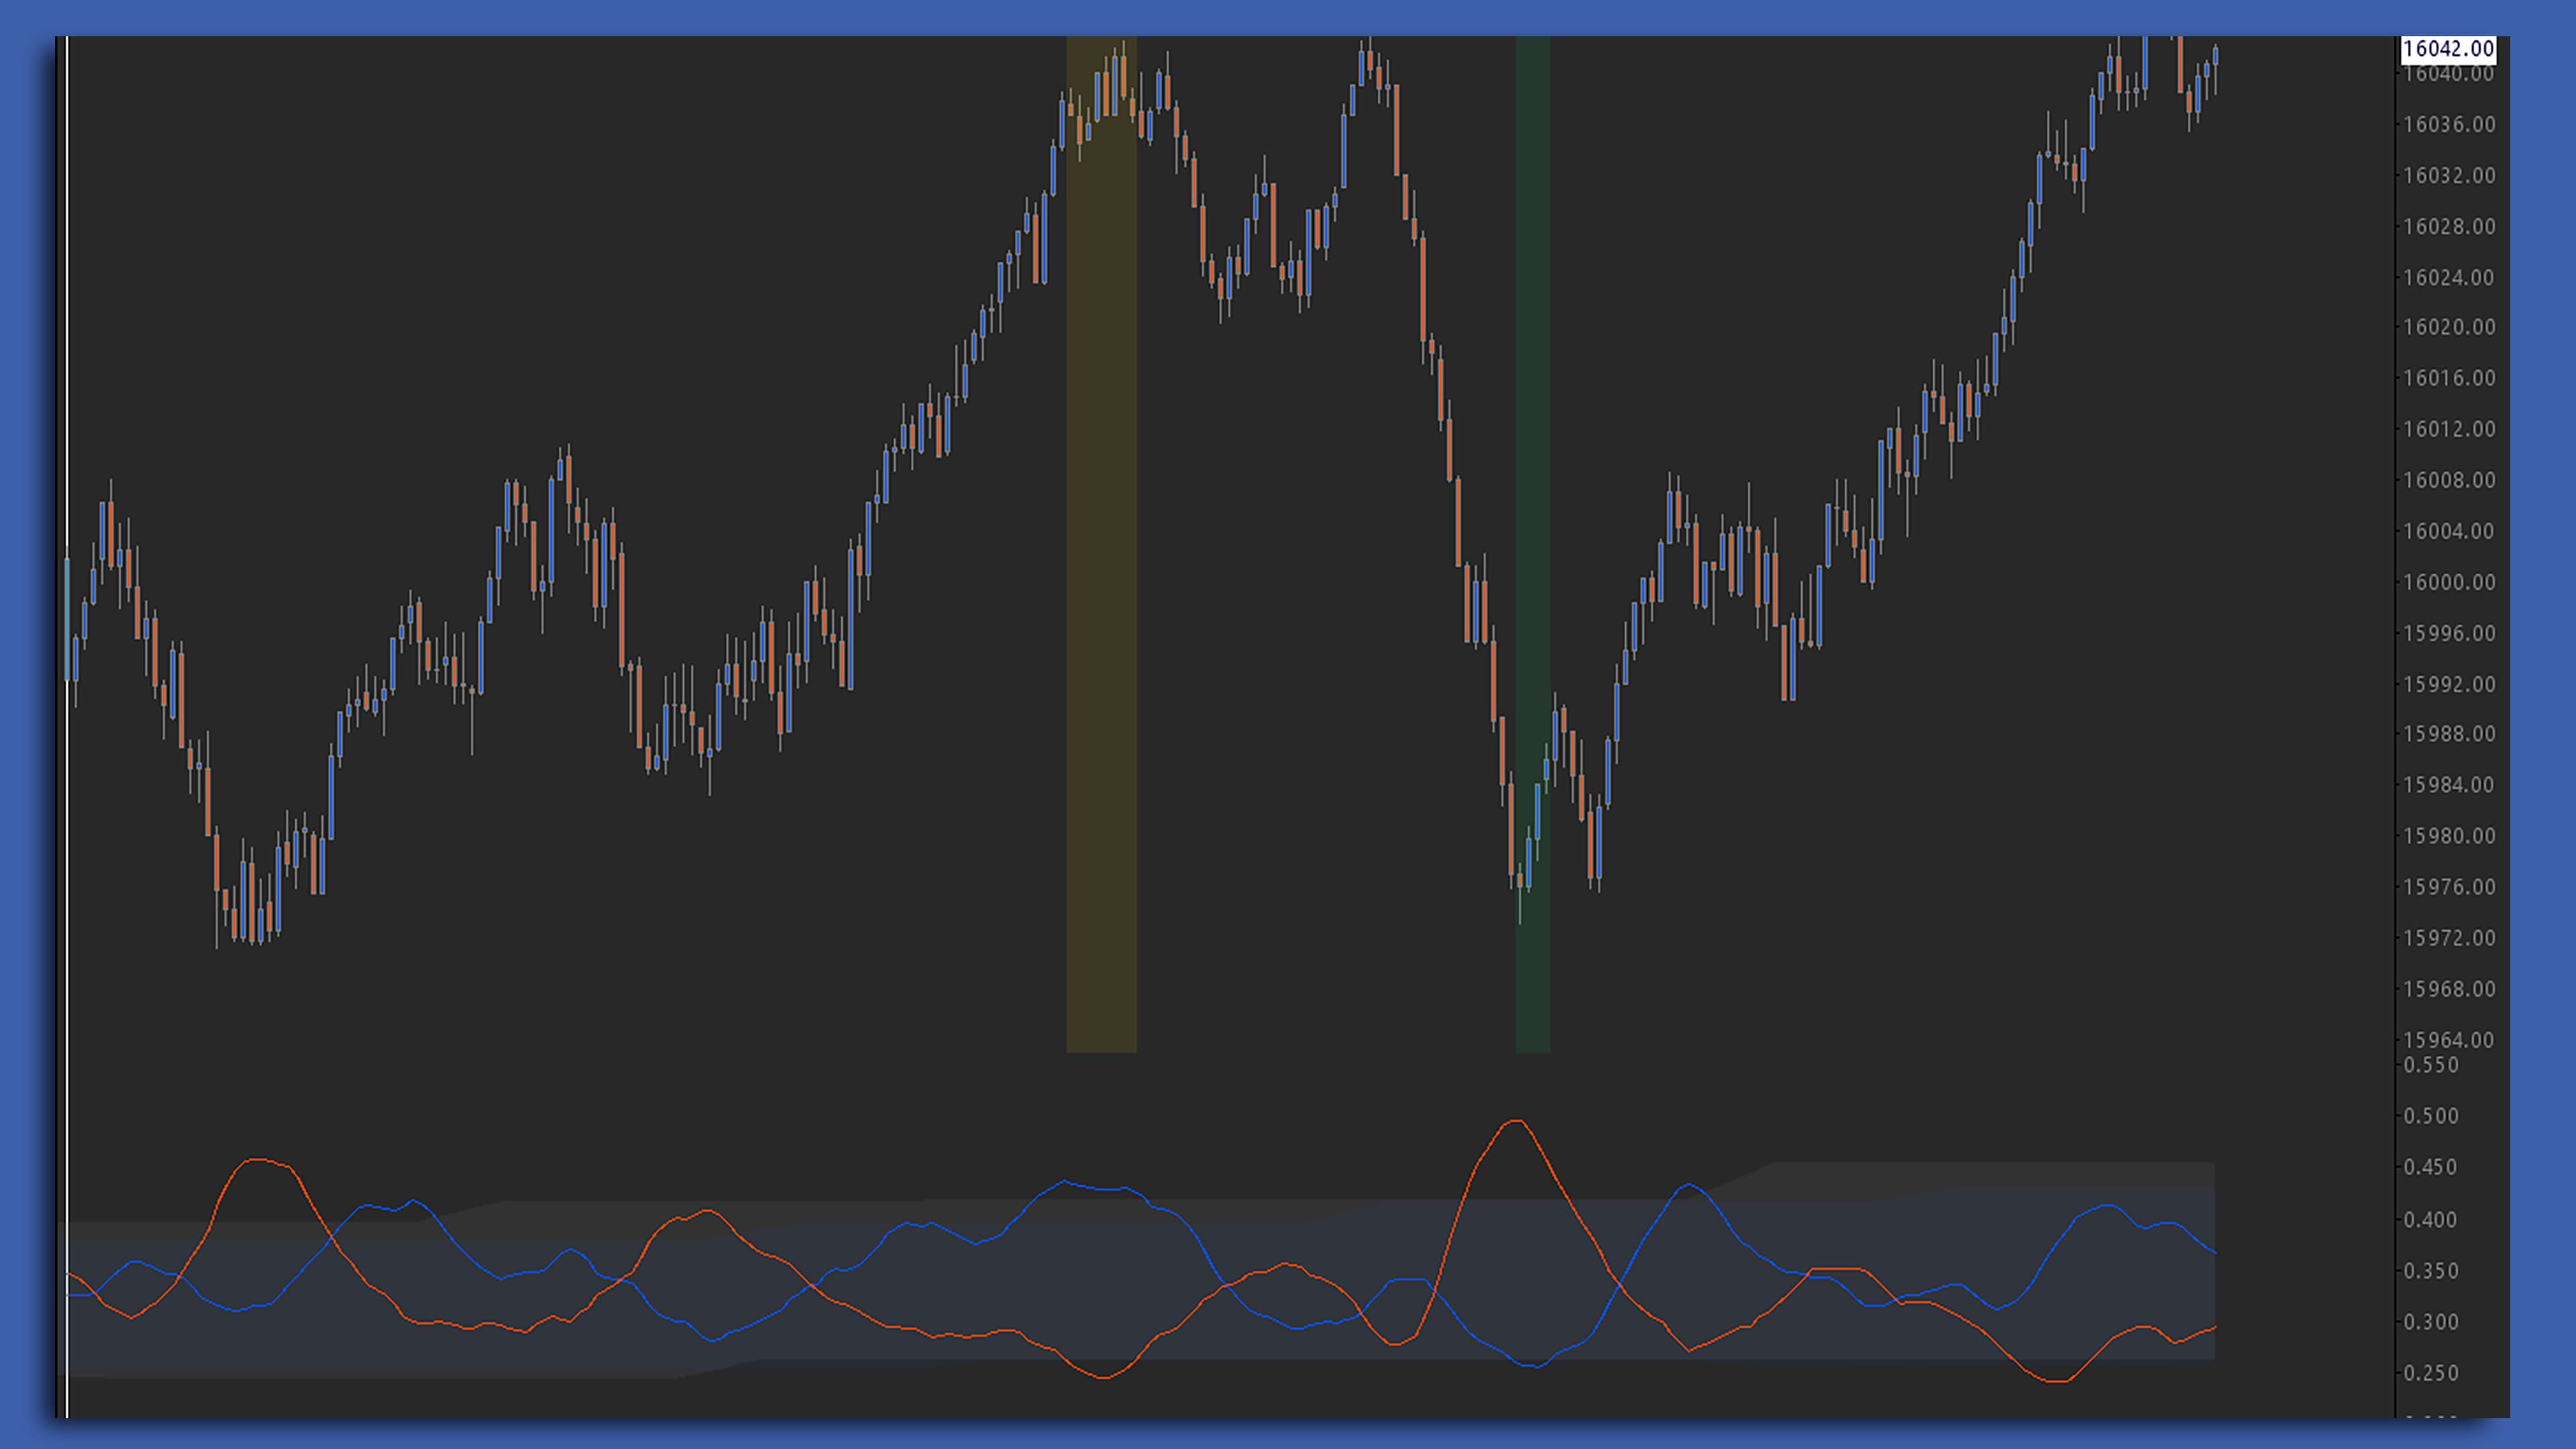
DVO Spread
A hardcoded Signal Combo of the Delta-Volume Oscillator identifying divergences between the Bid Ratio and Offer Ratio. DVO Spread pinpoints large discrepancies between buyers and sellers and can signal an imminent reversal as one side exhausts and the other initiates.
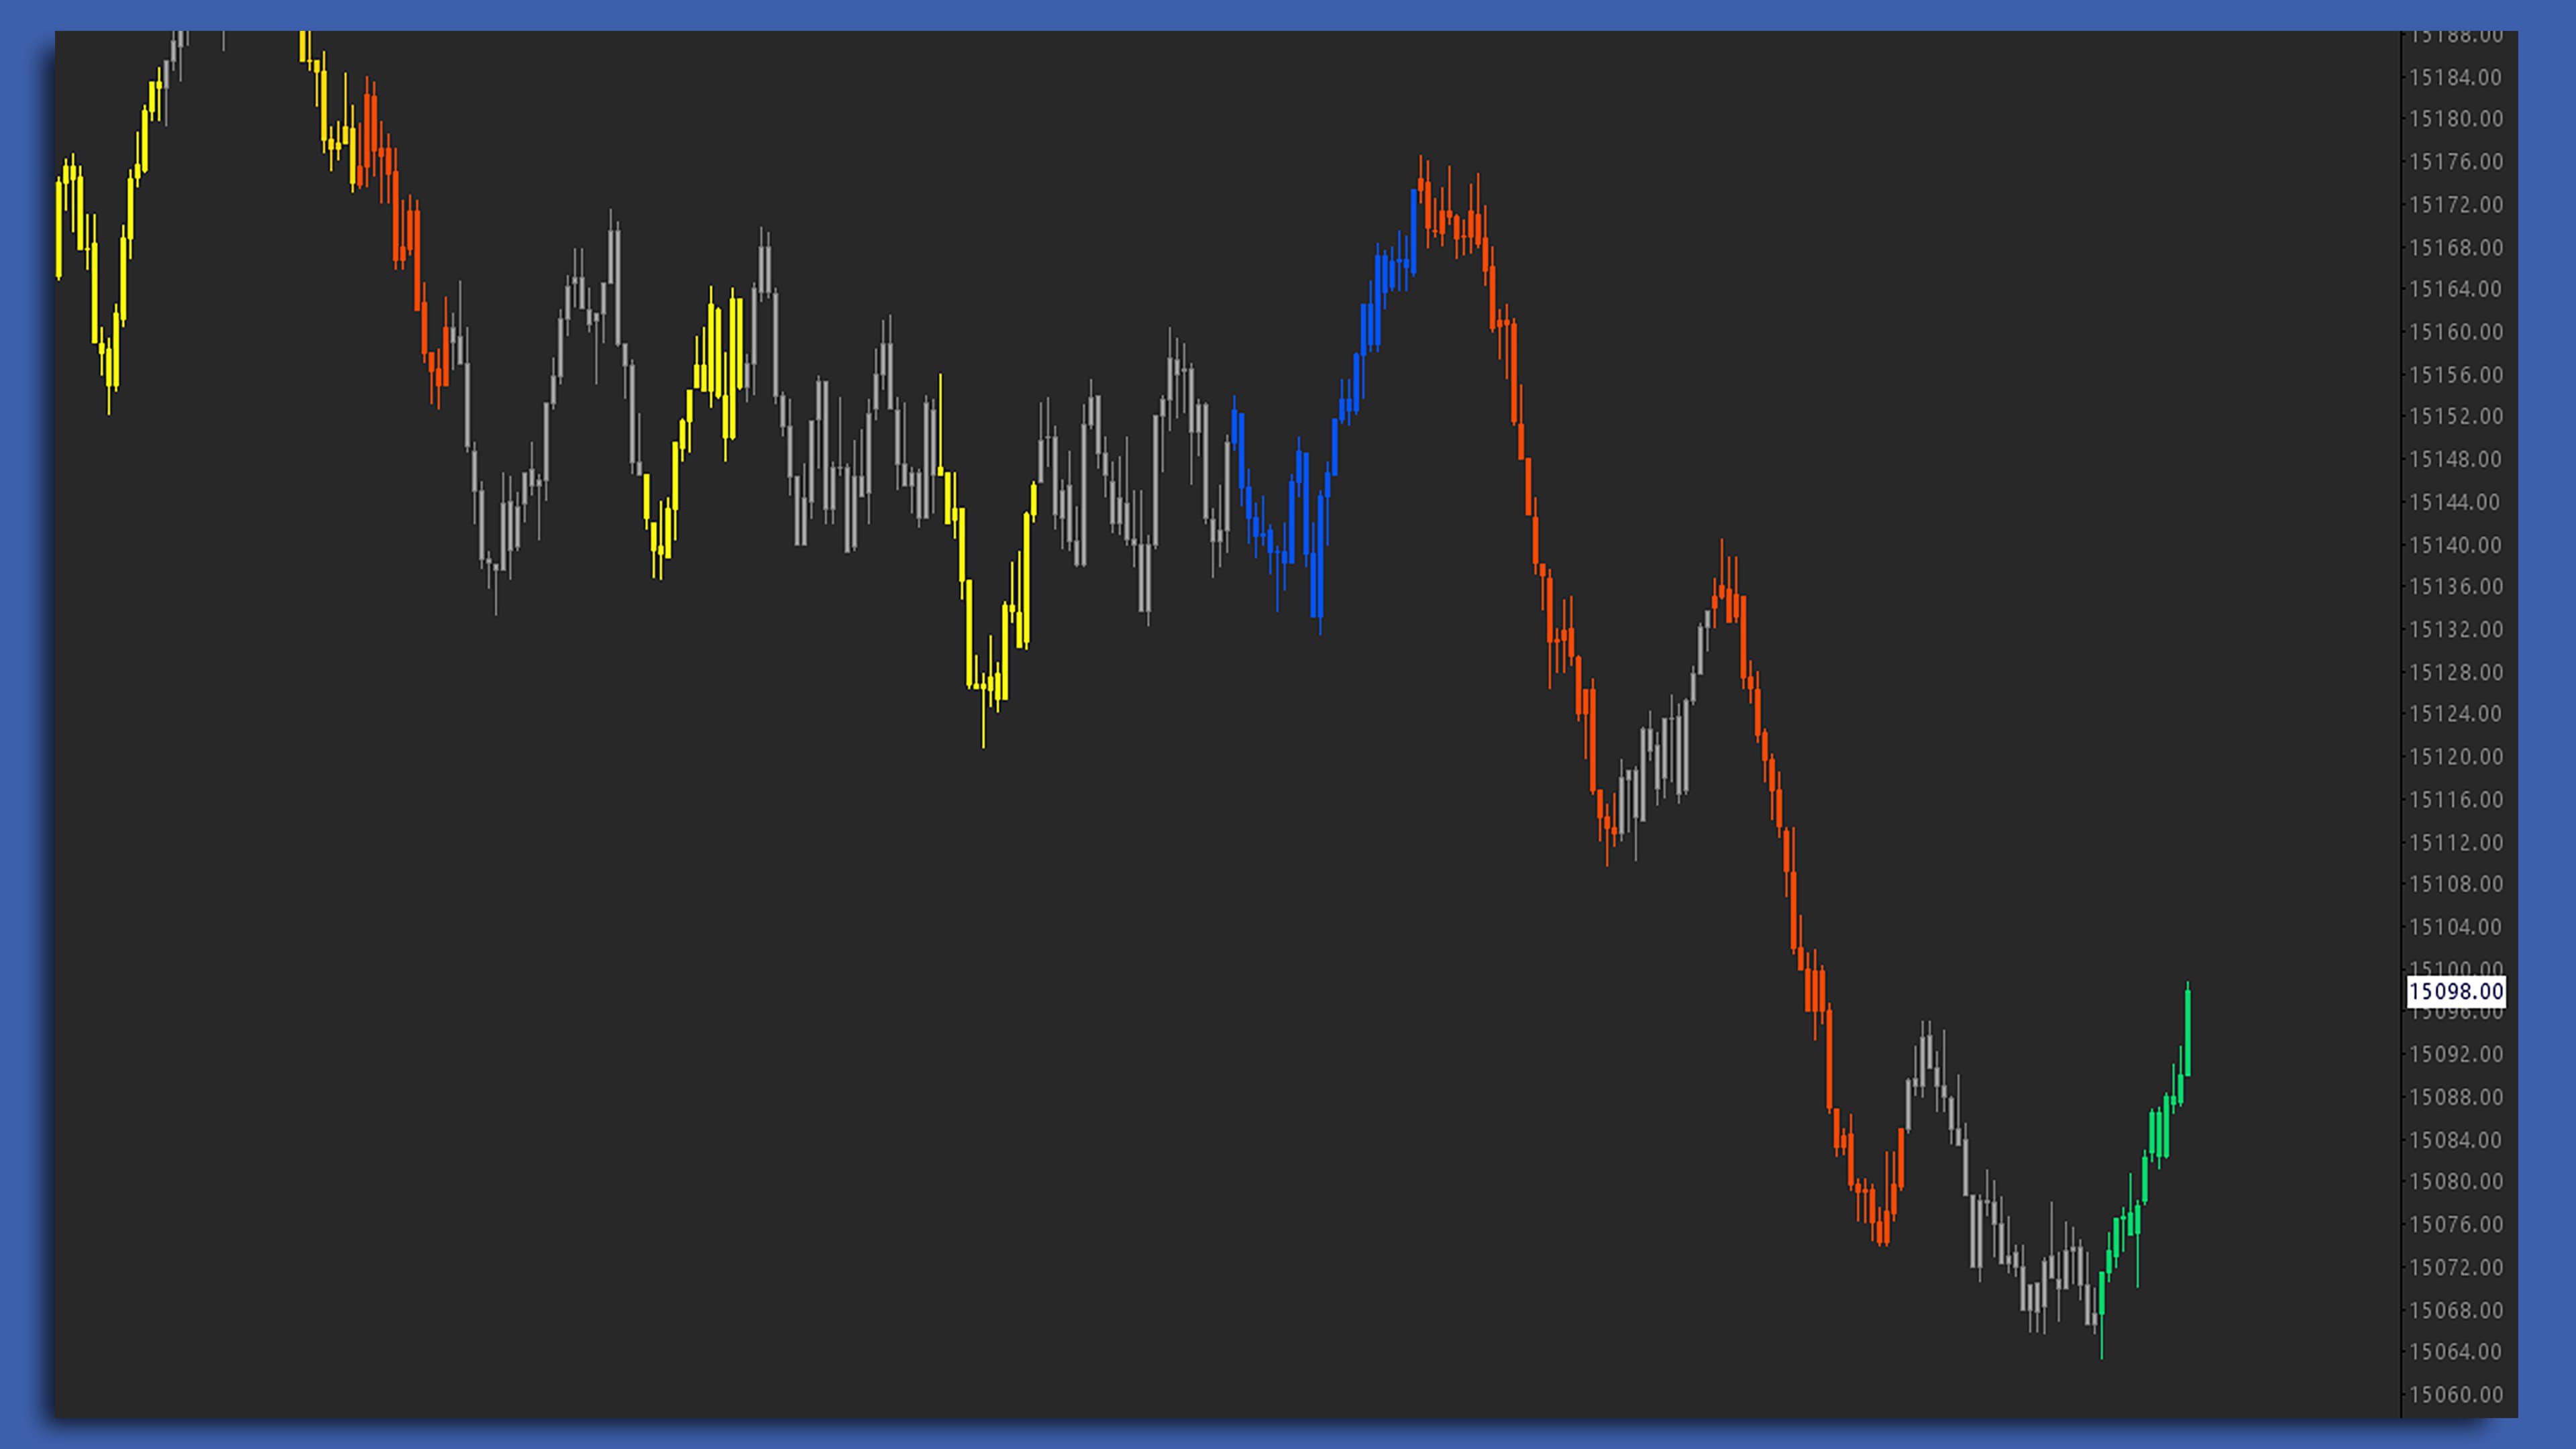
Dynamic Delta Bars
Visualize the closing strength and anomalous delta inside a bar chart without the need for a Delta Footprint. By tracking delta percentage relative to previous activity, the Dynamic Delta Bars study adaptively colors the candles based on standard deviation extremes of cumulative delta as well as peak delta compared to closing delta.
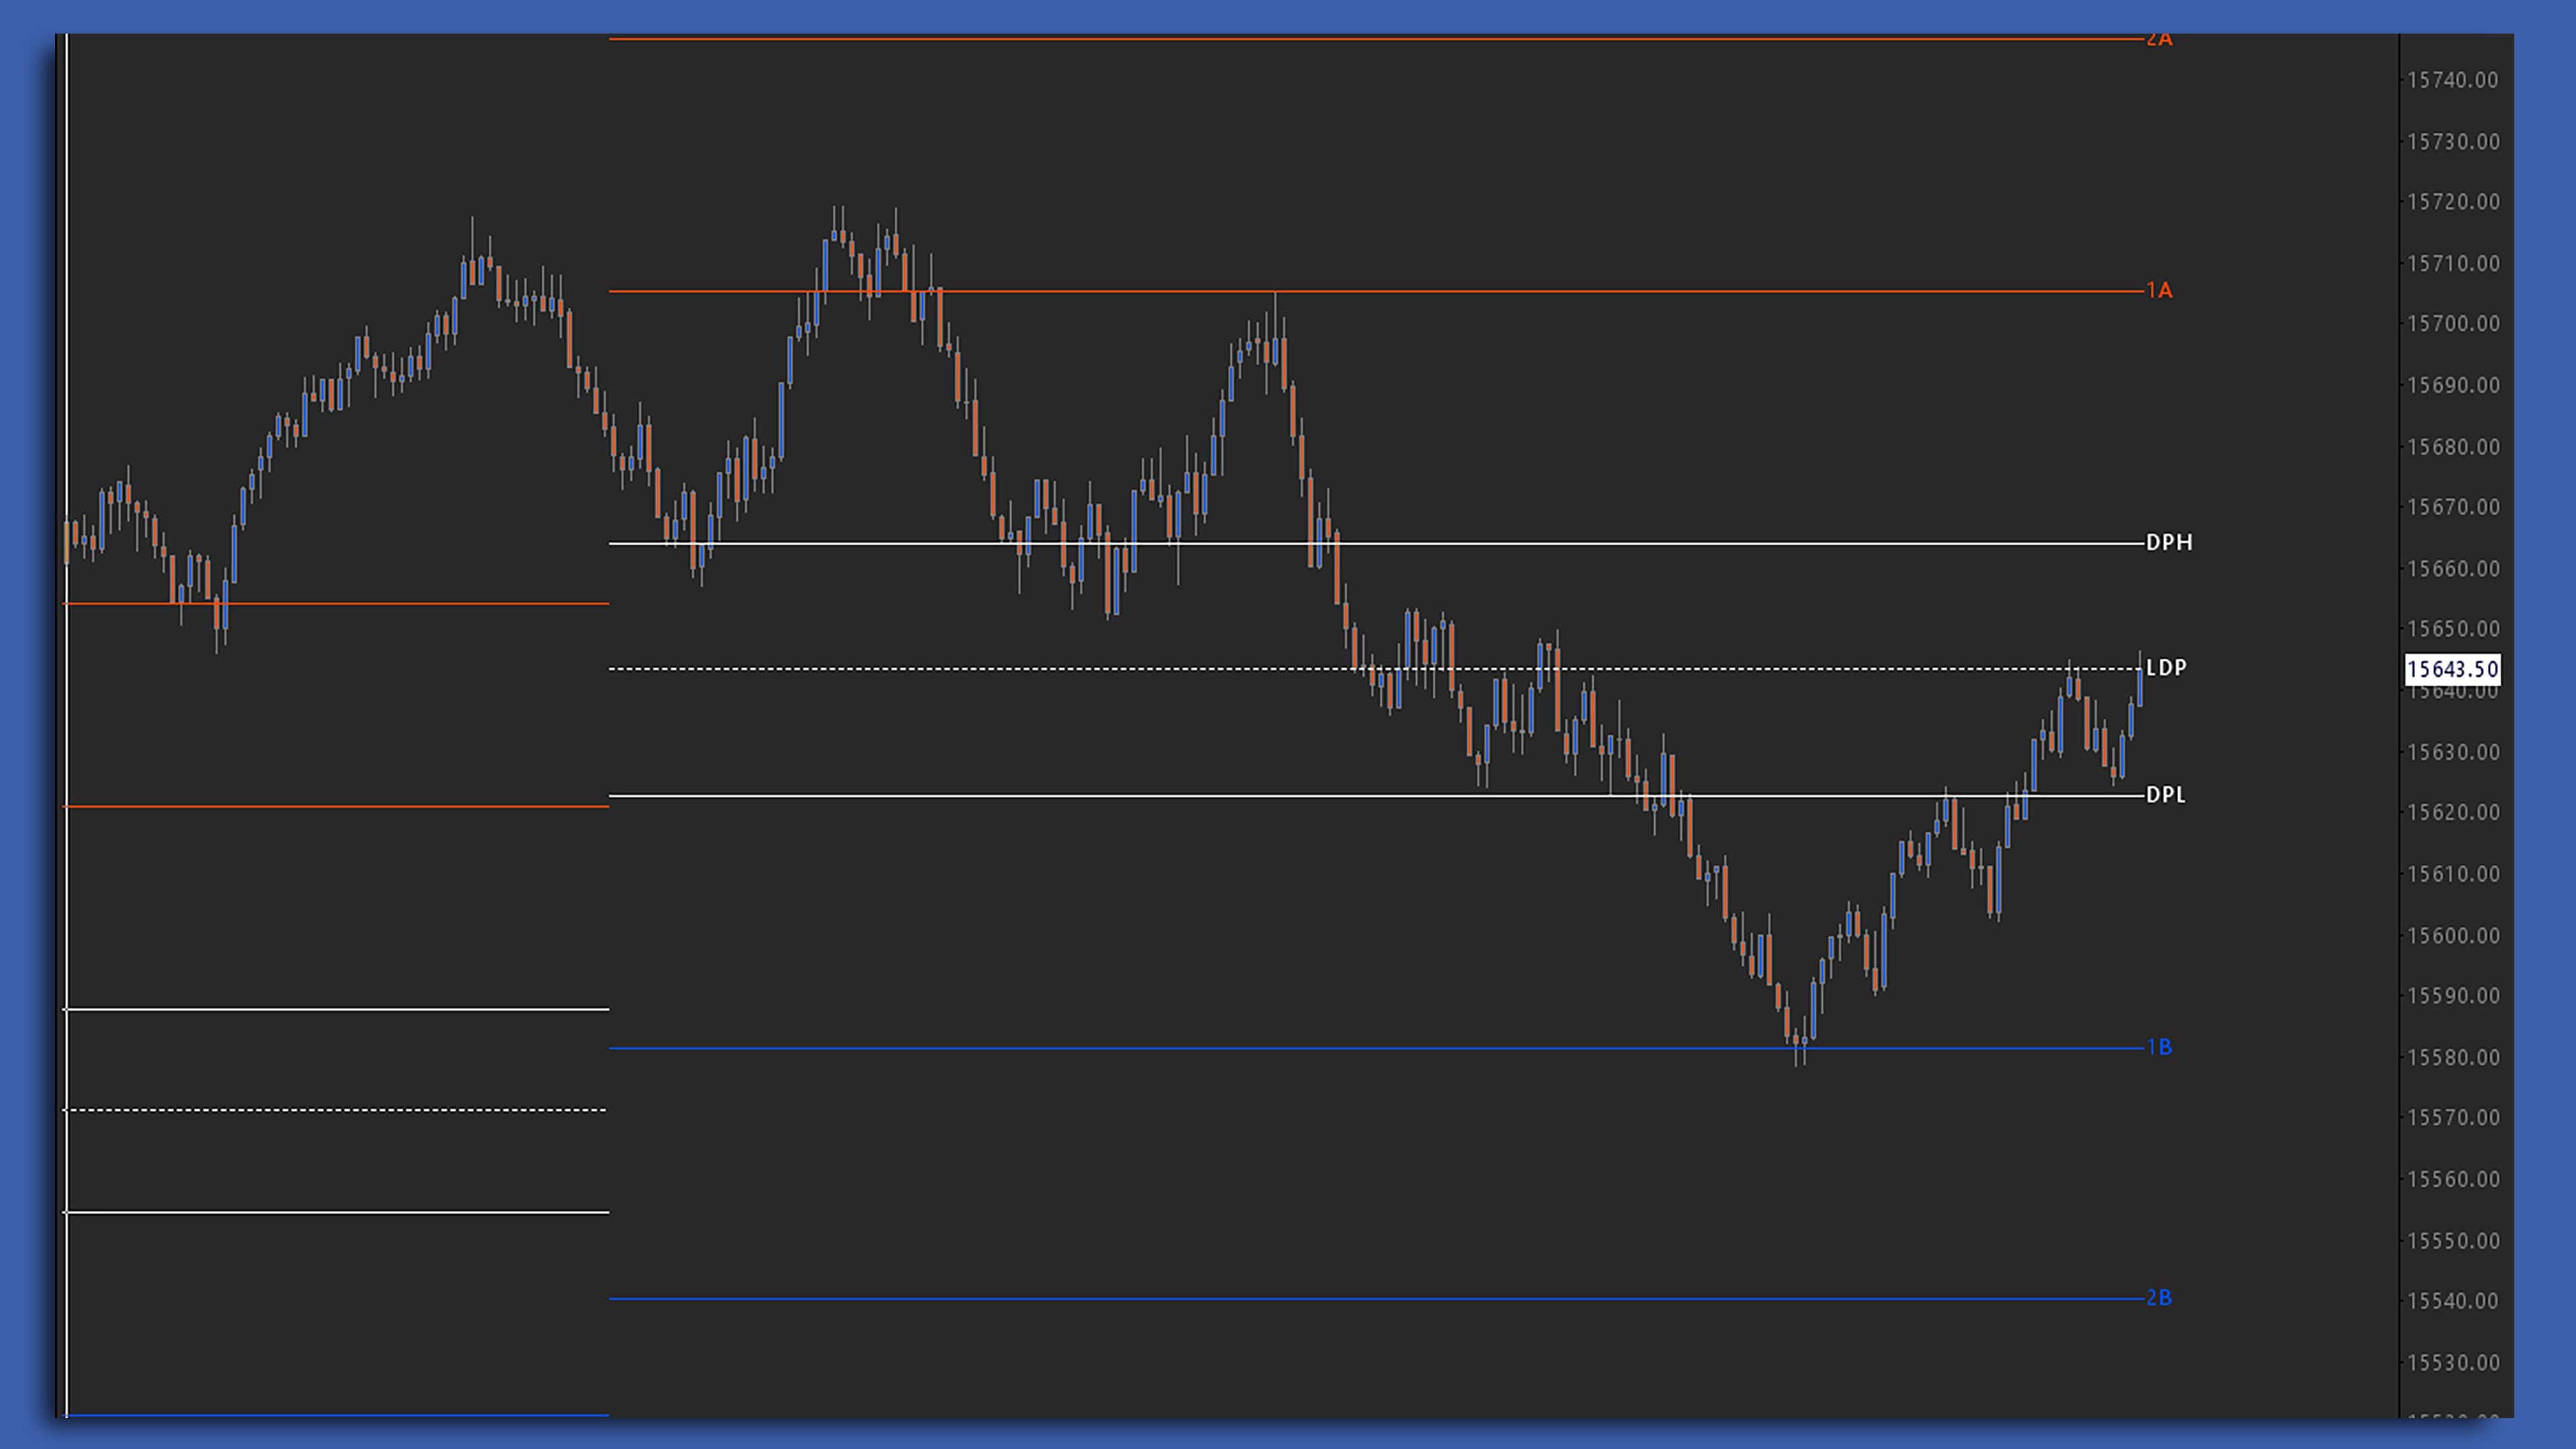
Dynamic Delta Pivots
An adaptation of the logic behind LTF Delta Pivots which distinguishes multiple impulsive ranges and pivot points as the auction progresses. The Dynamic Delta Pivots study locates aggressive flows, allowing traders to filter for levels of standard deviation, anchor to specific dates, and display multiple ranges and pivots.
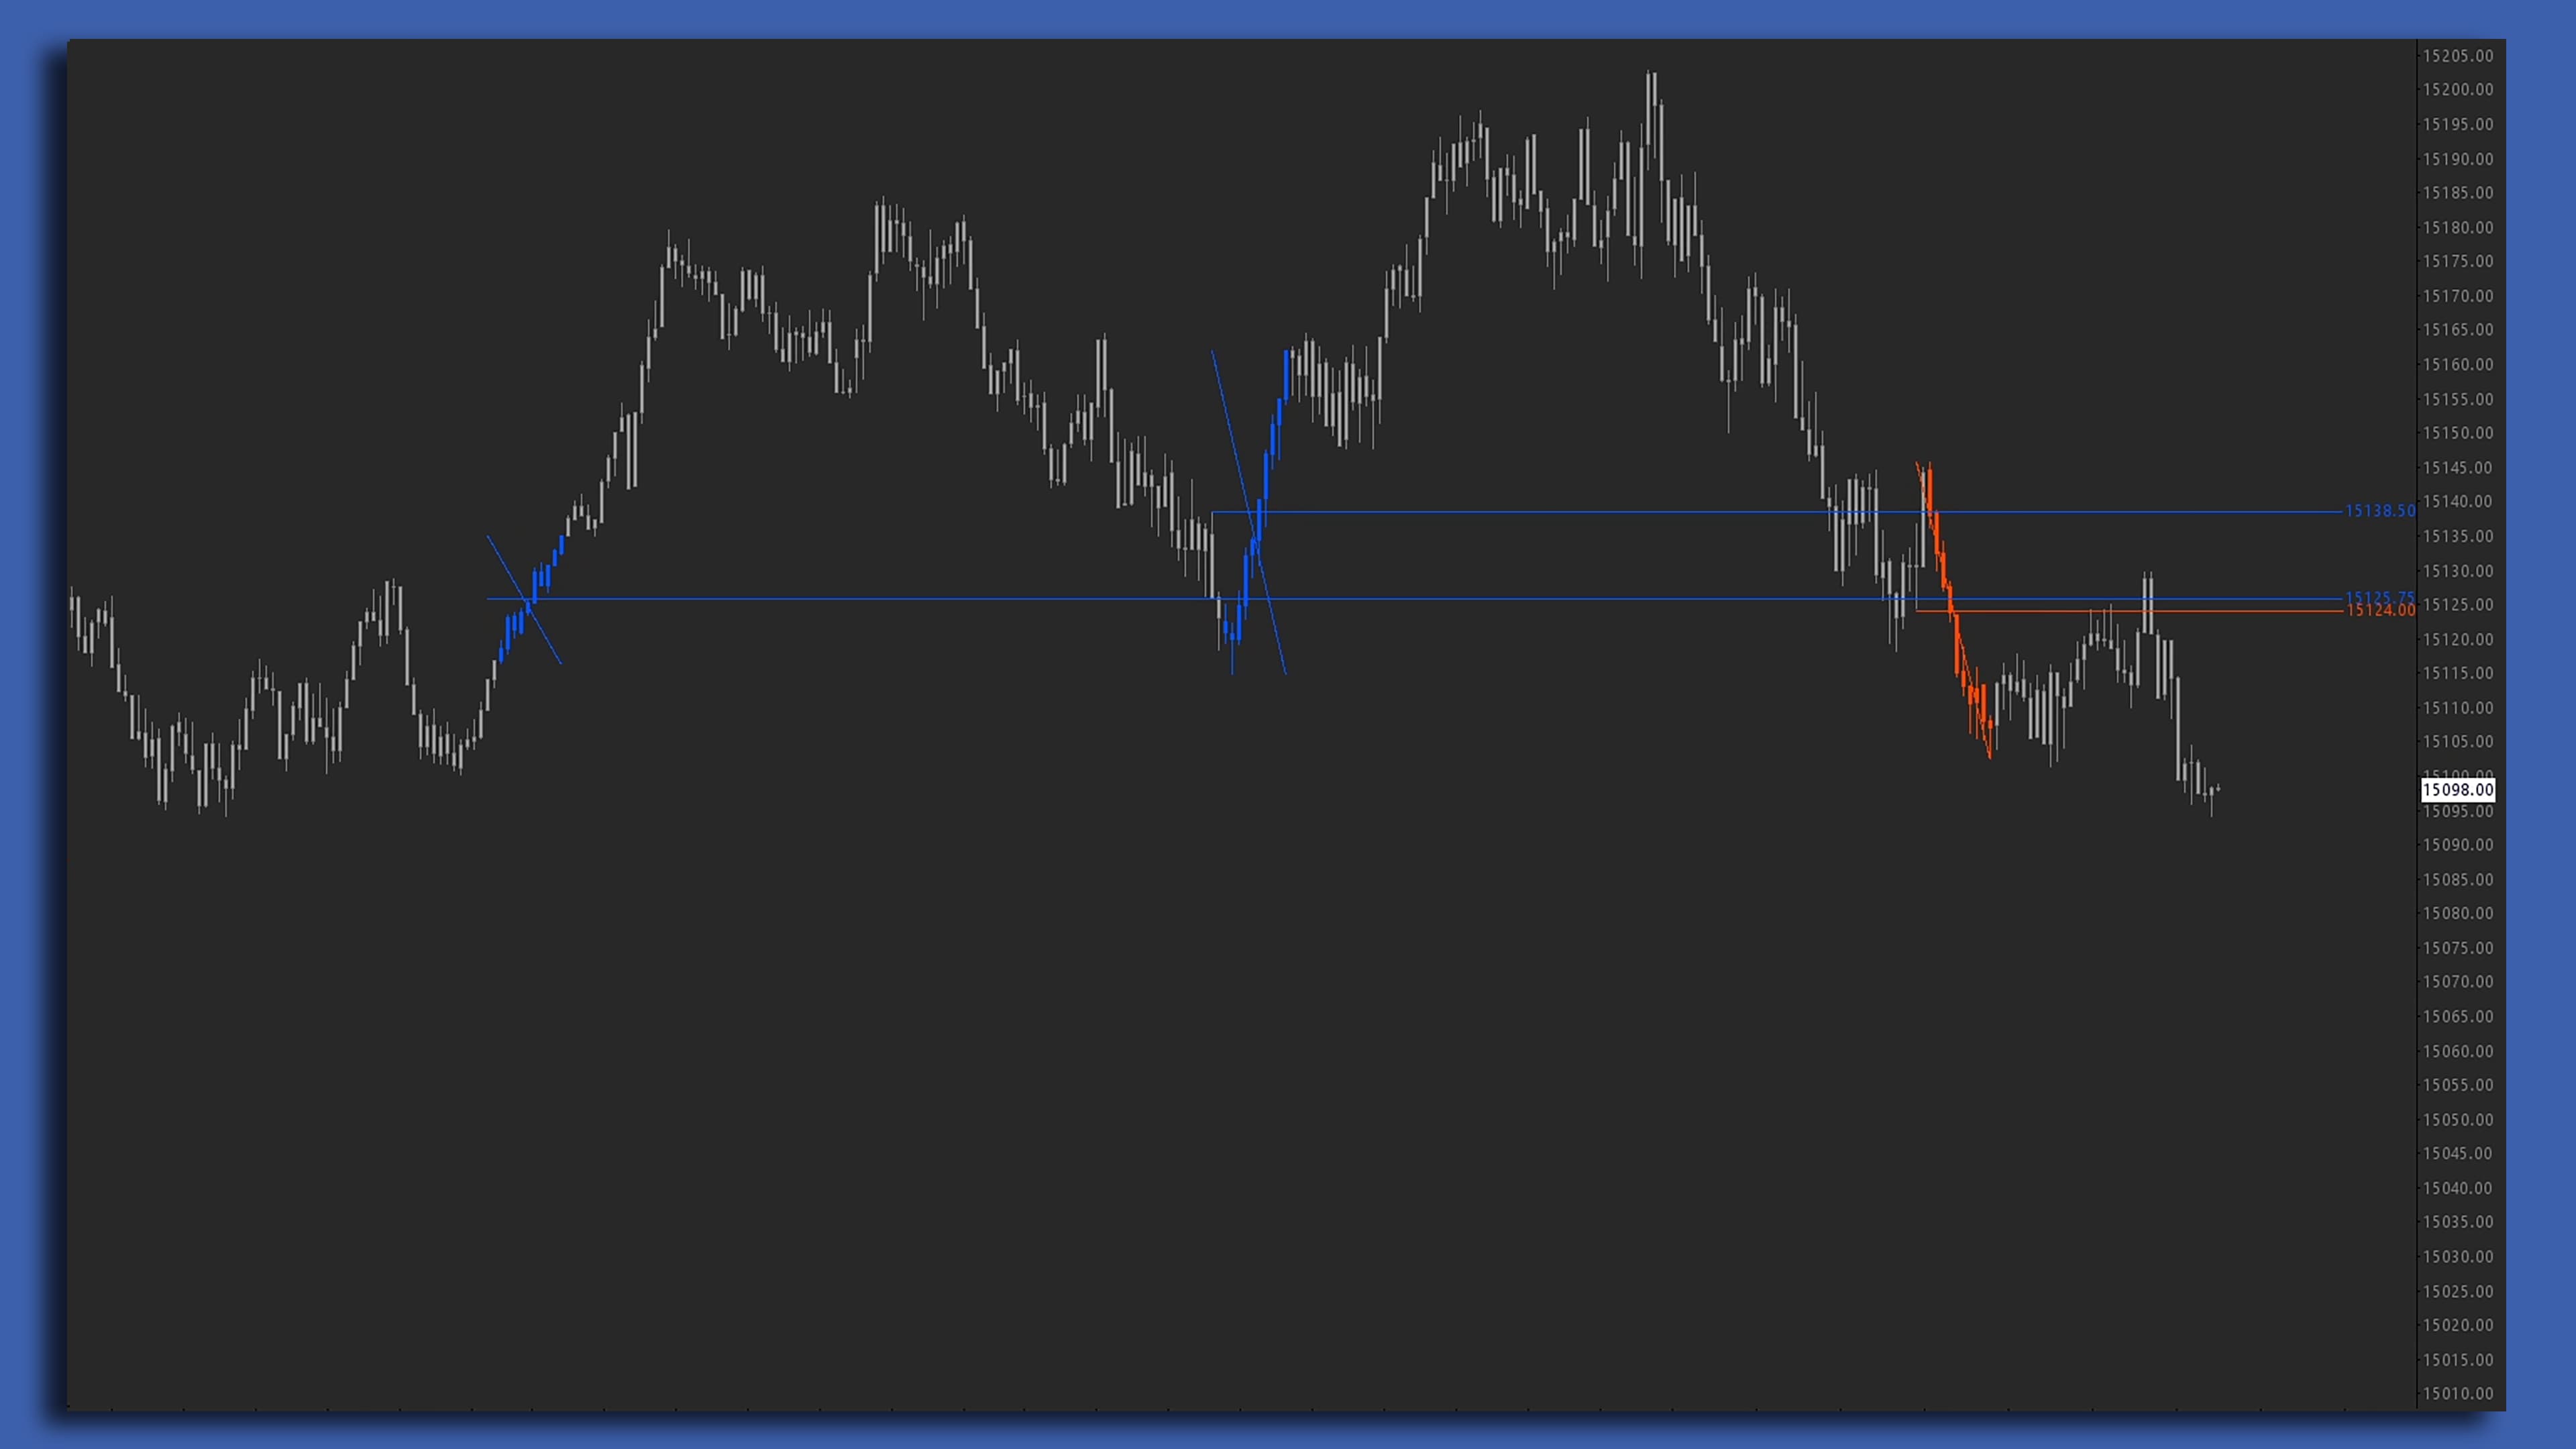
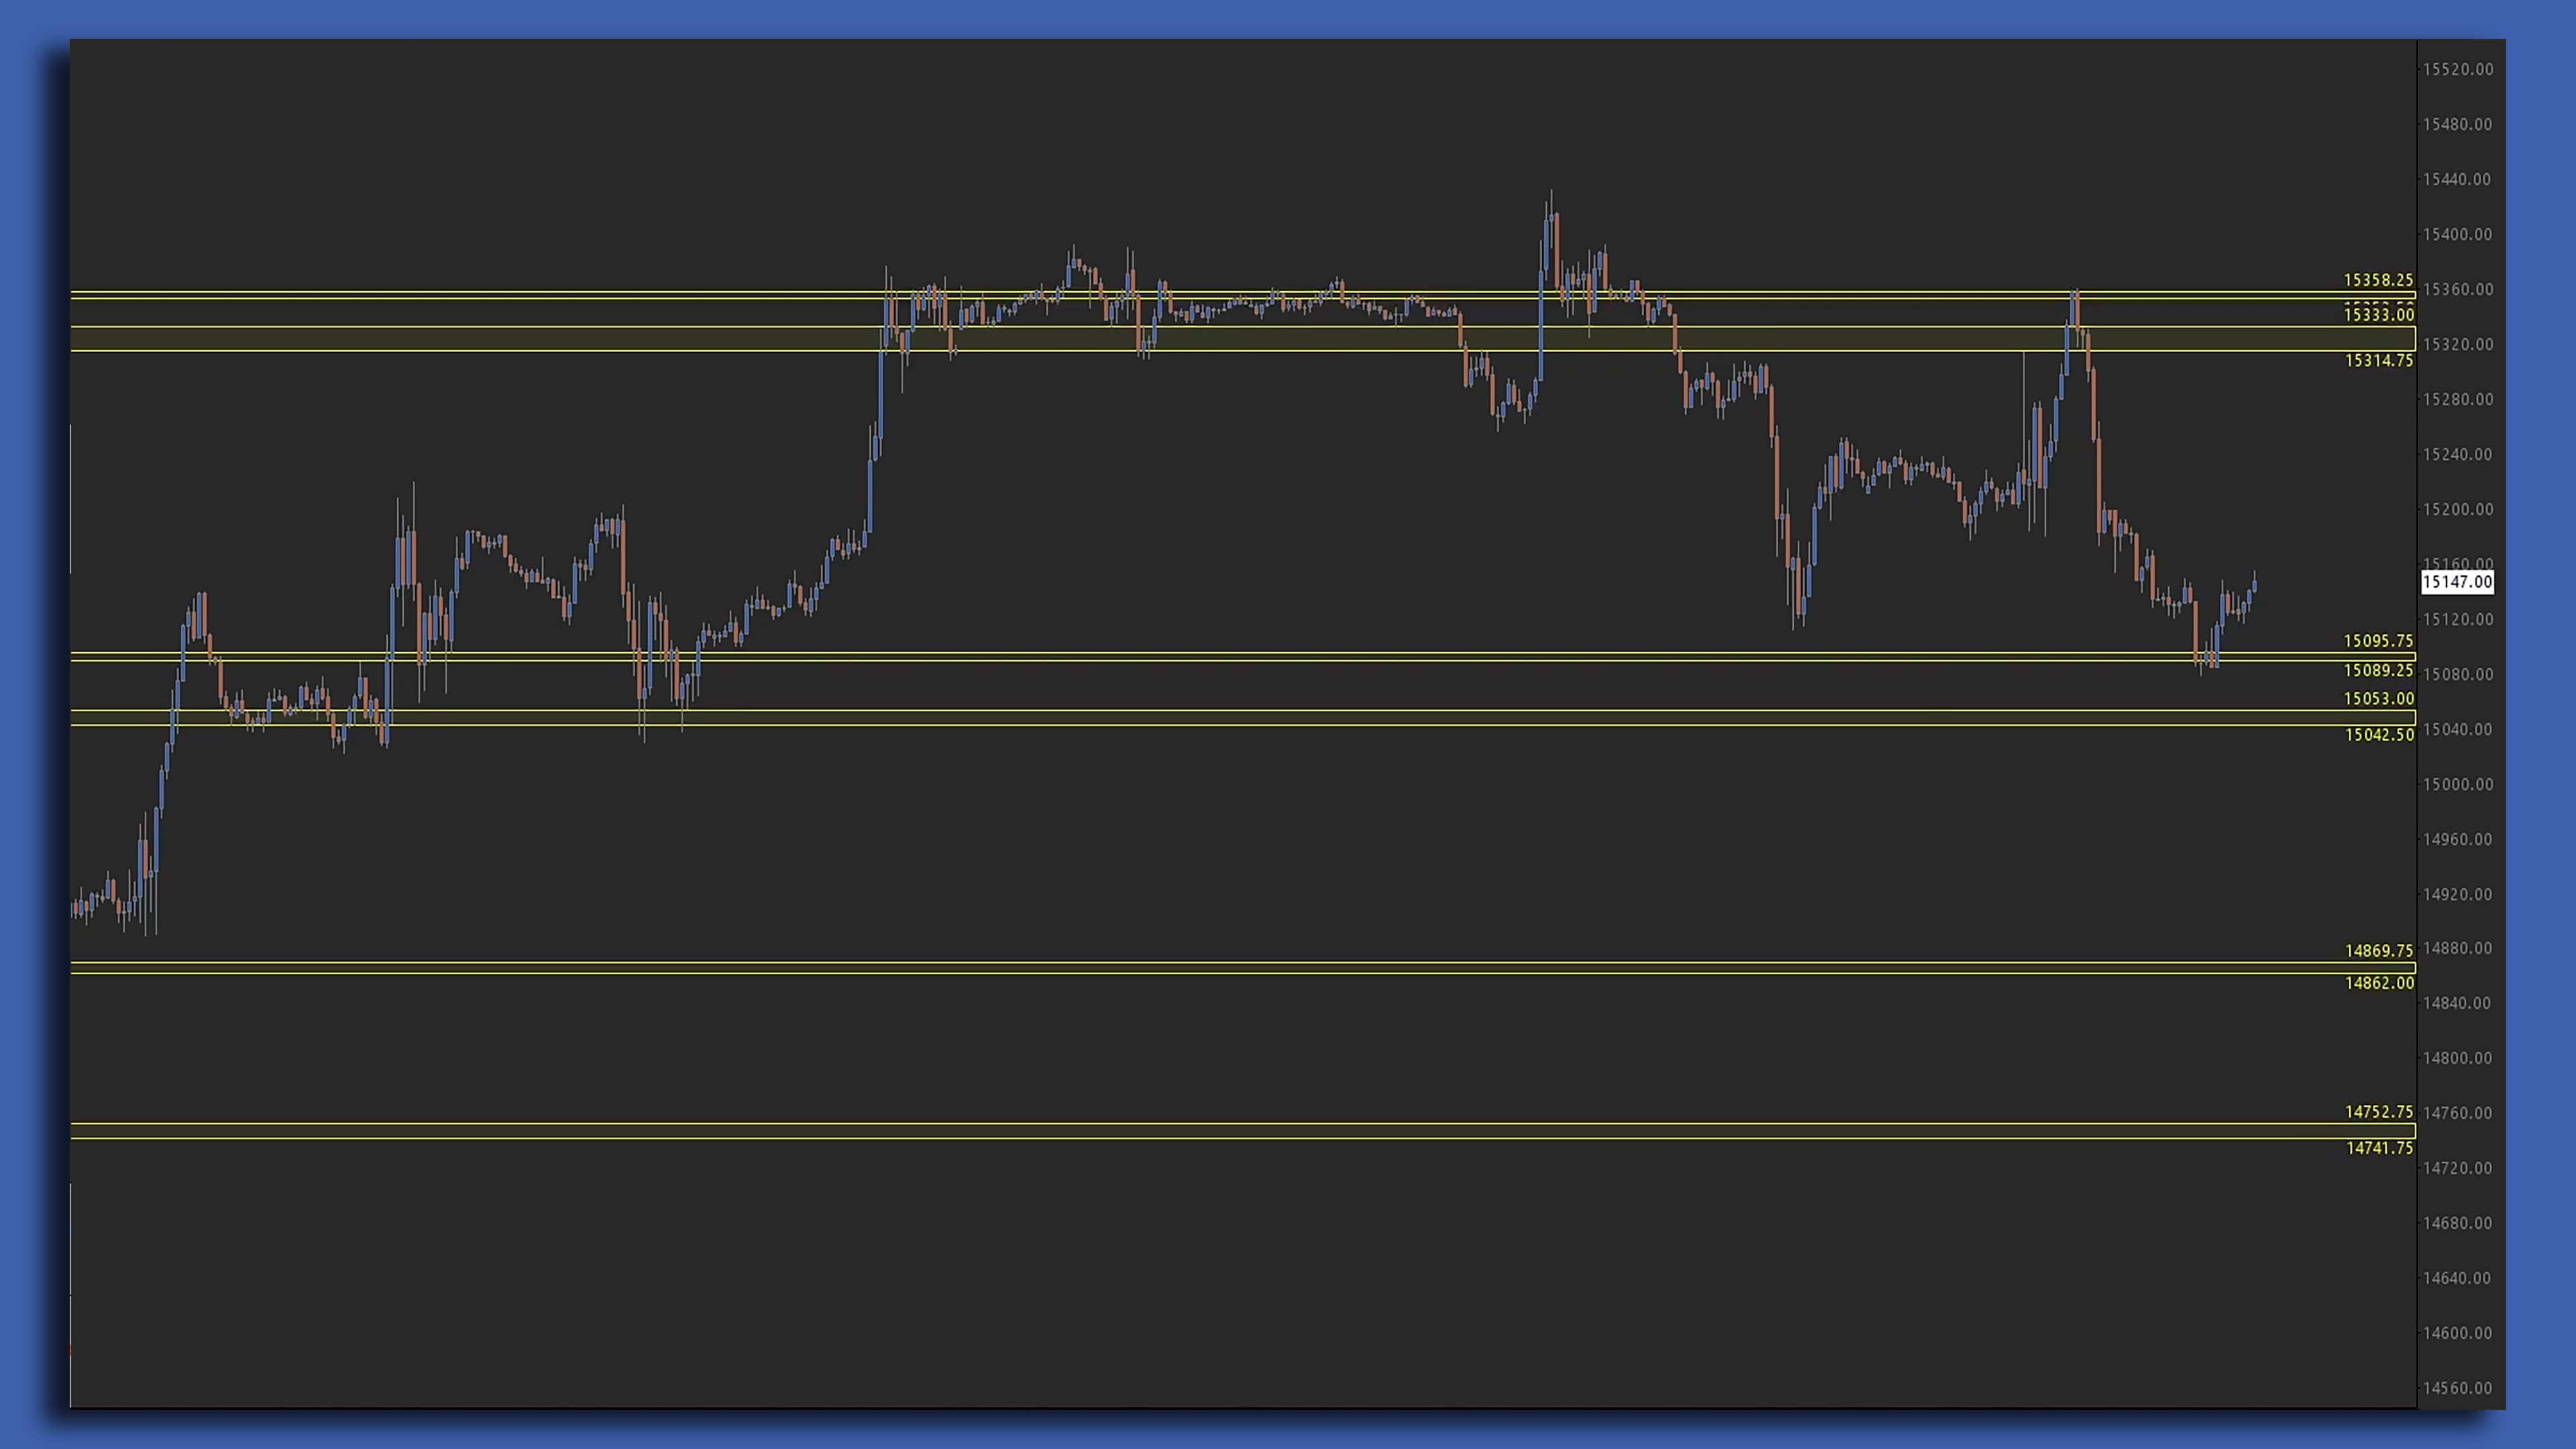
Gained-Lost Levels
Analyze swing highs and lows for mathematically significant moves in price action and automatically plot levels of horizontal support and resistance. The Gained-Lost Levels study simplifies the process of identifying noteworthy Legs or sequences of Legs (called ‘Moves’) and generates key structure in the market on any timeframe as the auction progresses.
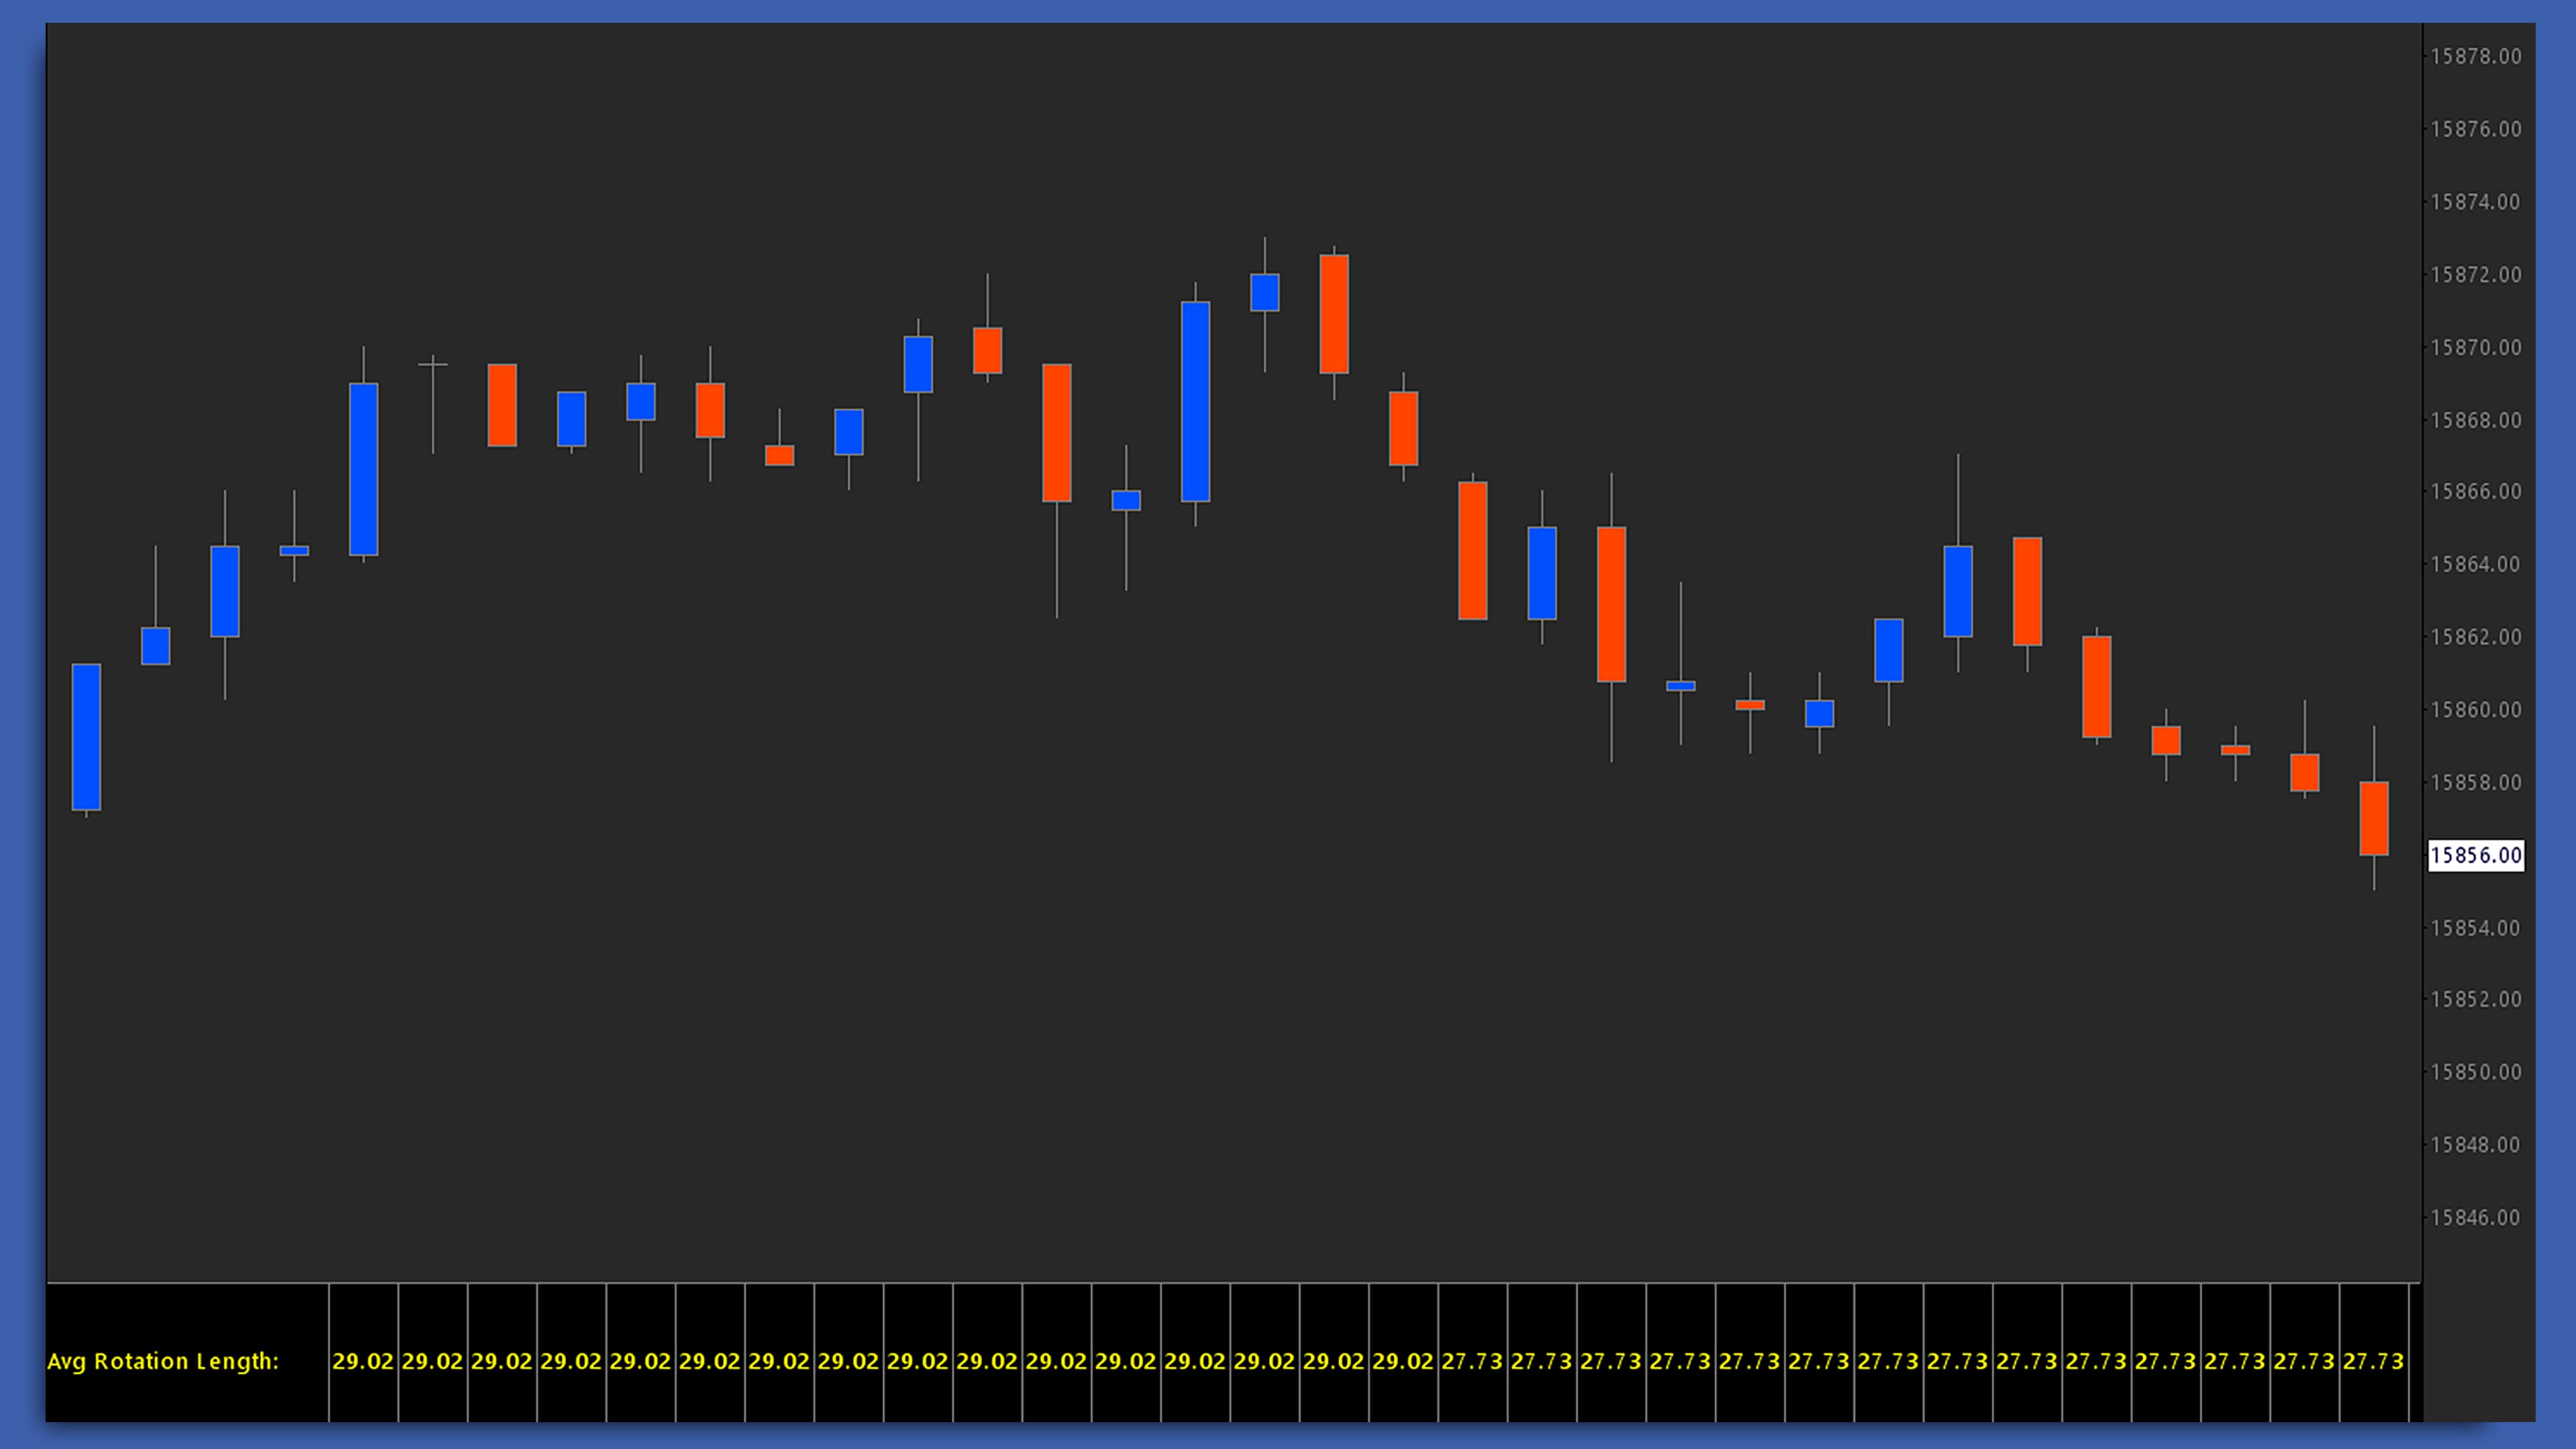
Harmonic Rotations
Monitor price trends in the market through changing patterns of price bars, observing whether they rise or fall over specific periods. A sequence-based examination of price bars, the Harmonic Rotations study is intended to reveal typical price rotation lengths, thereby offering useful insights into the rhythm and pattern of market movements.
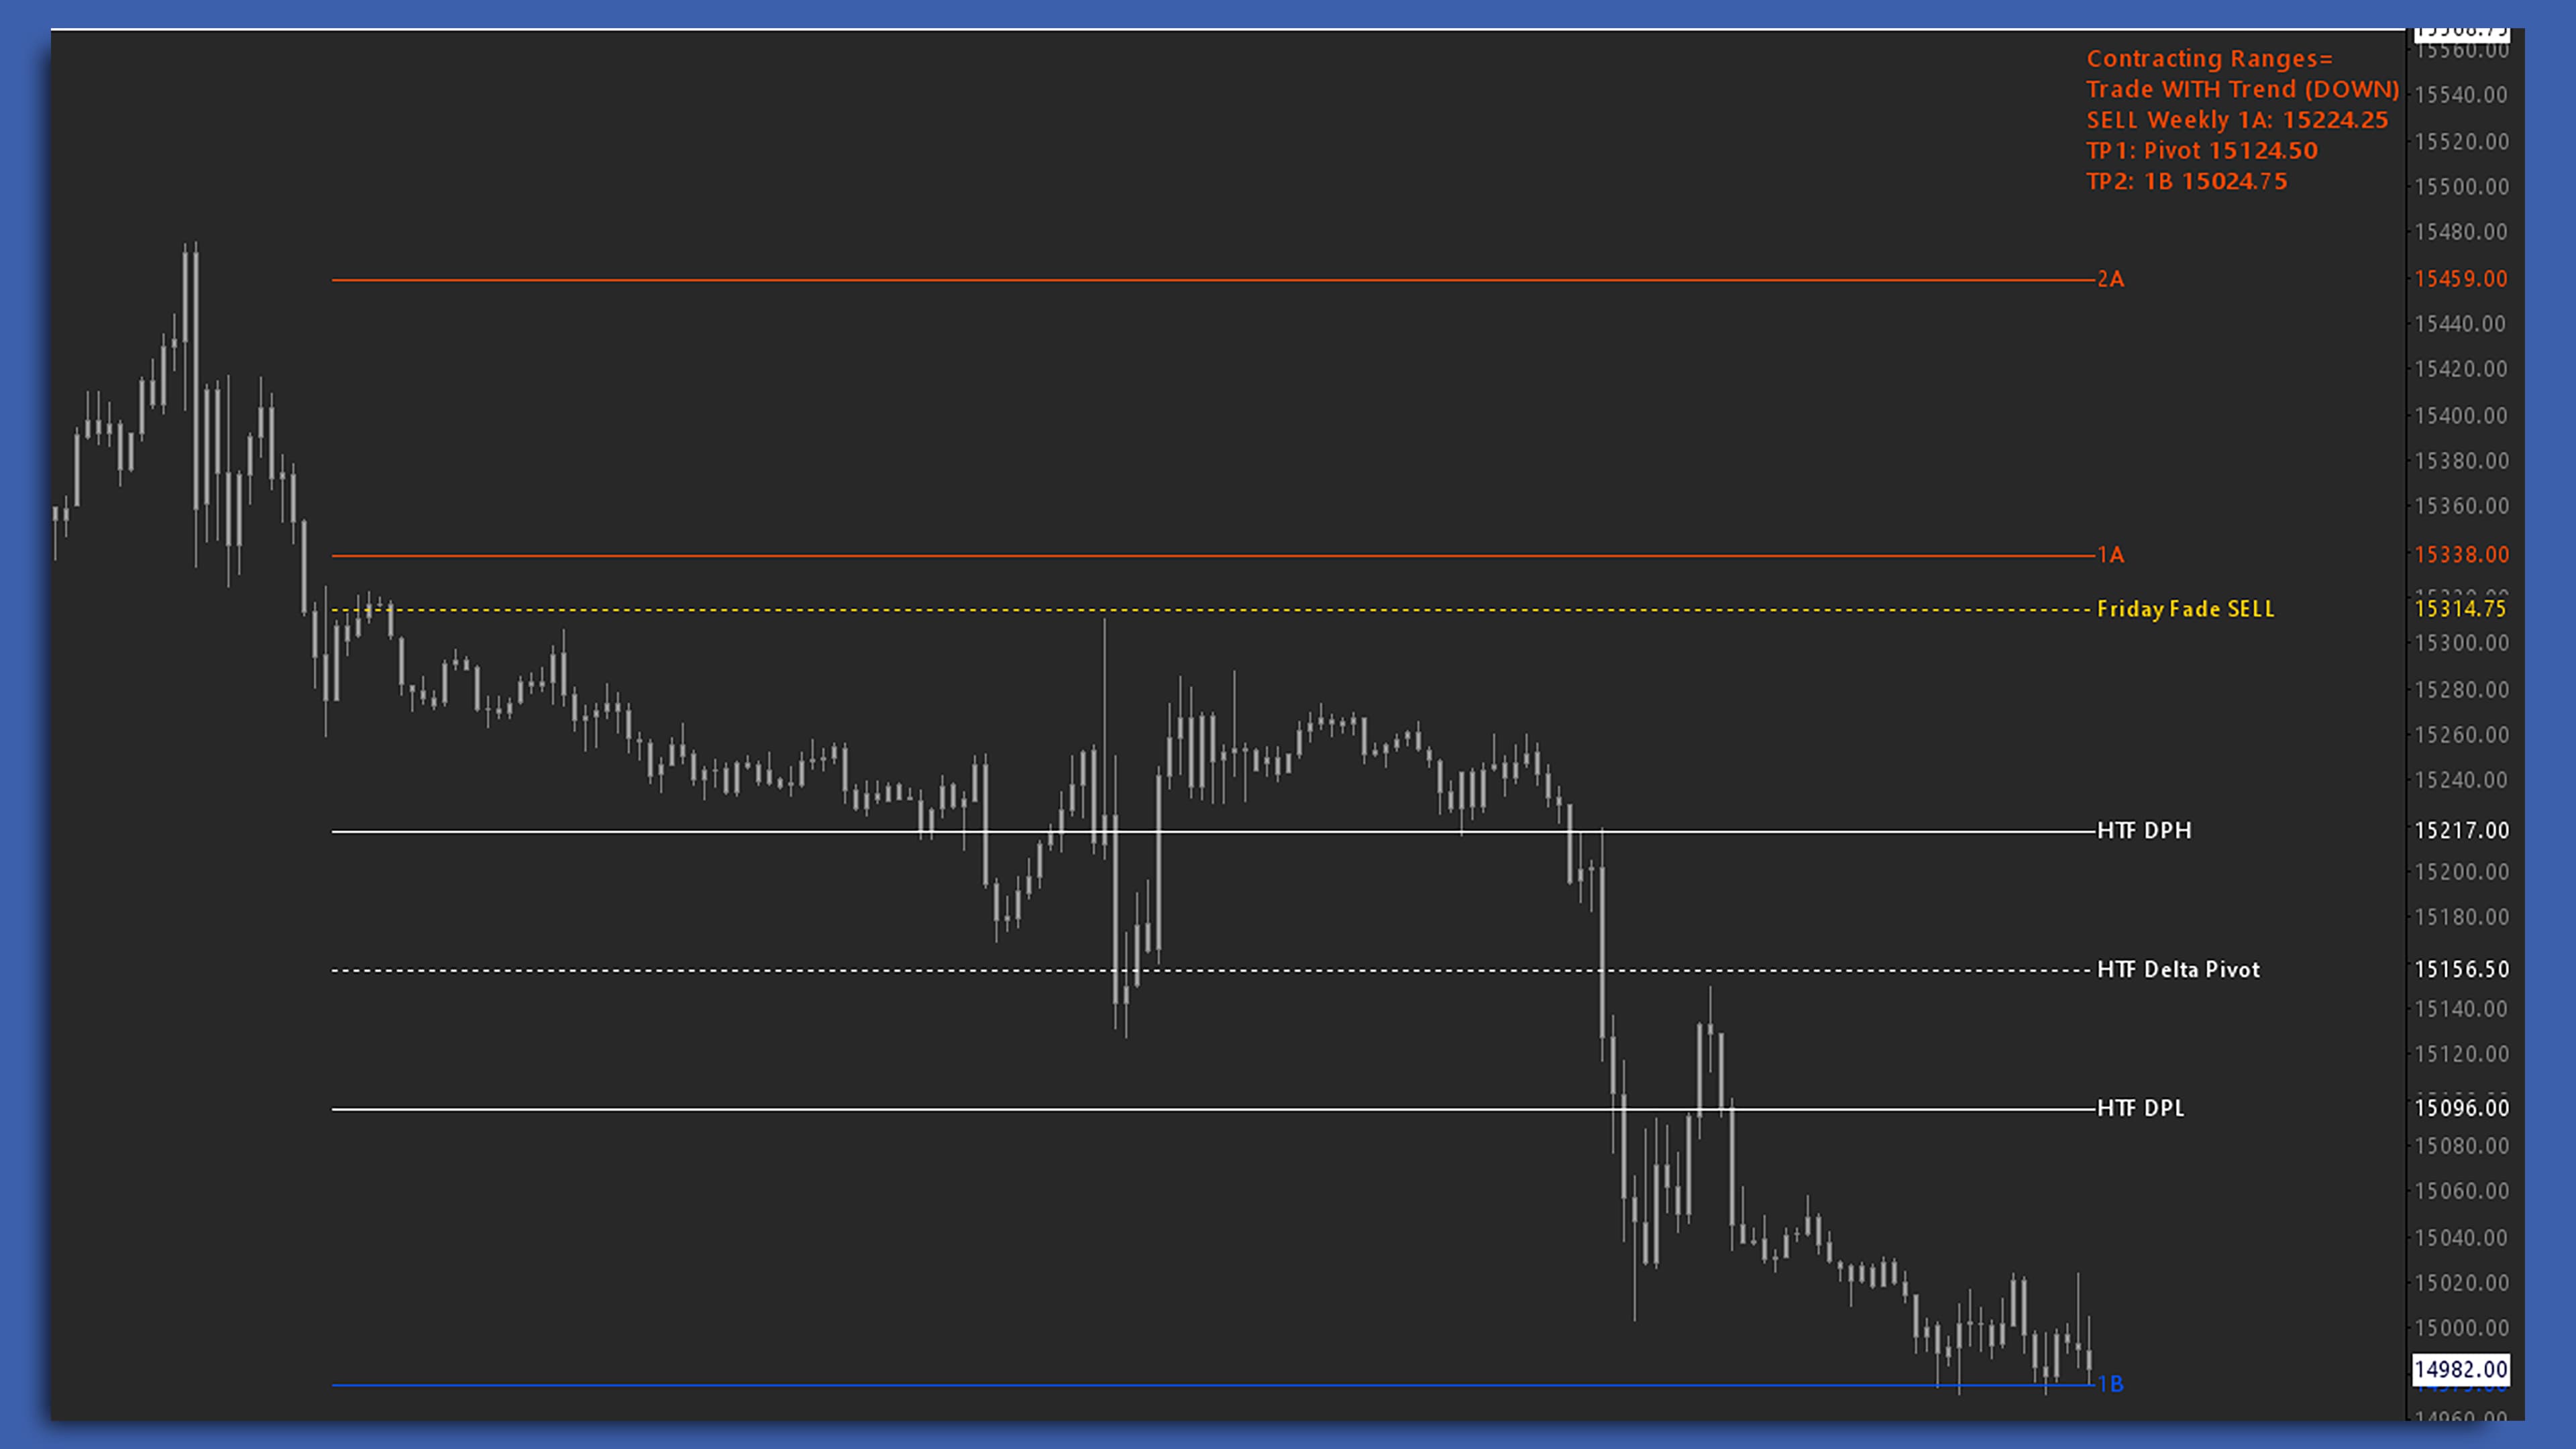
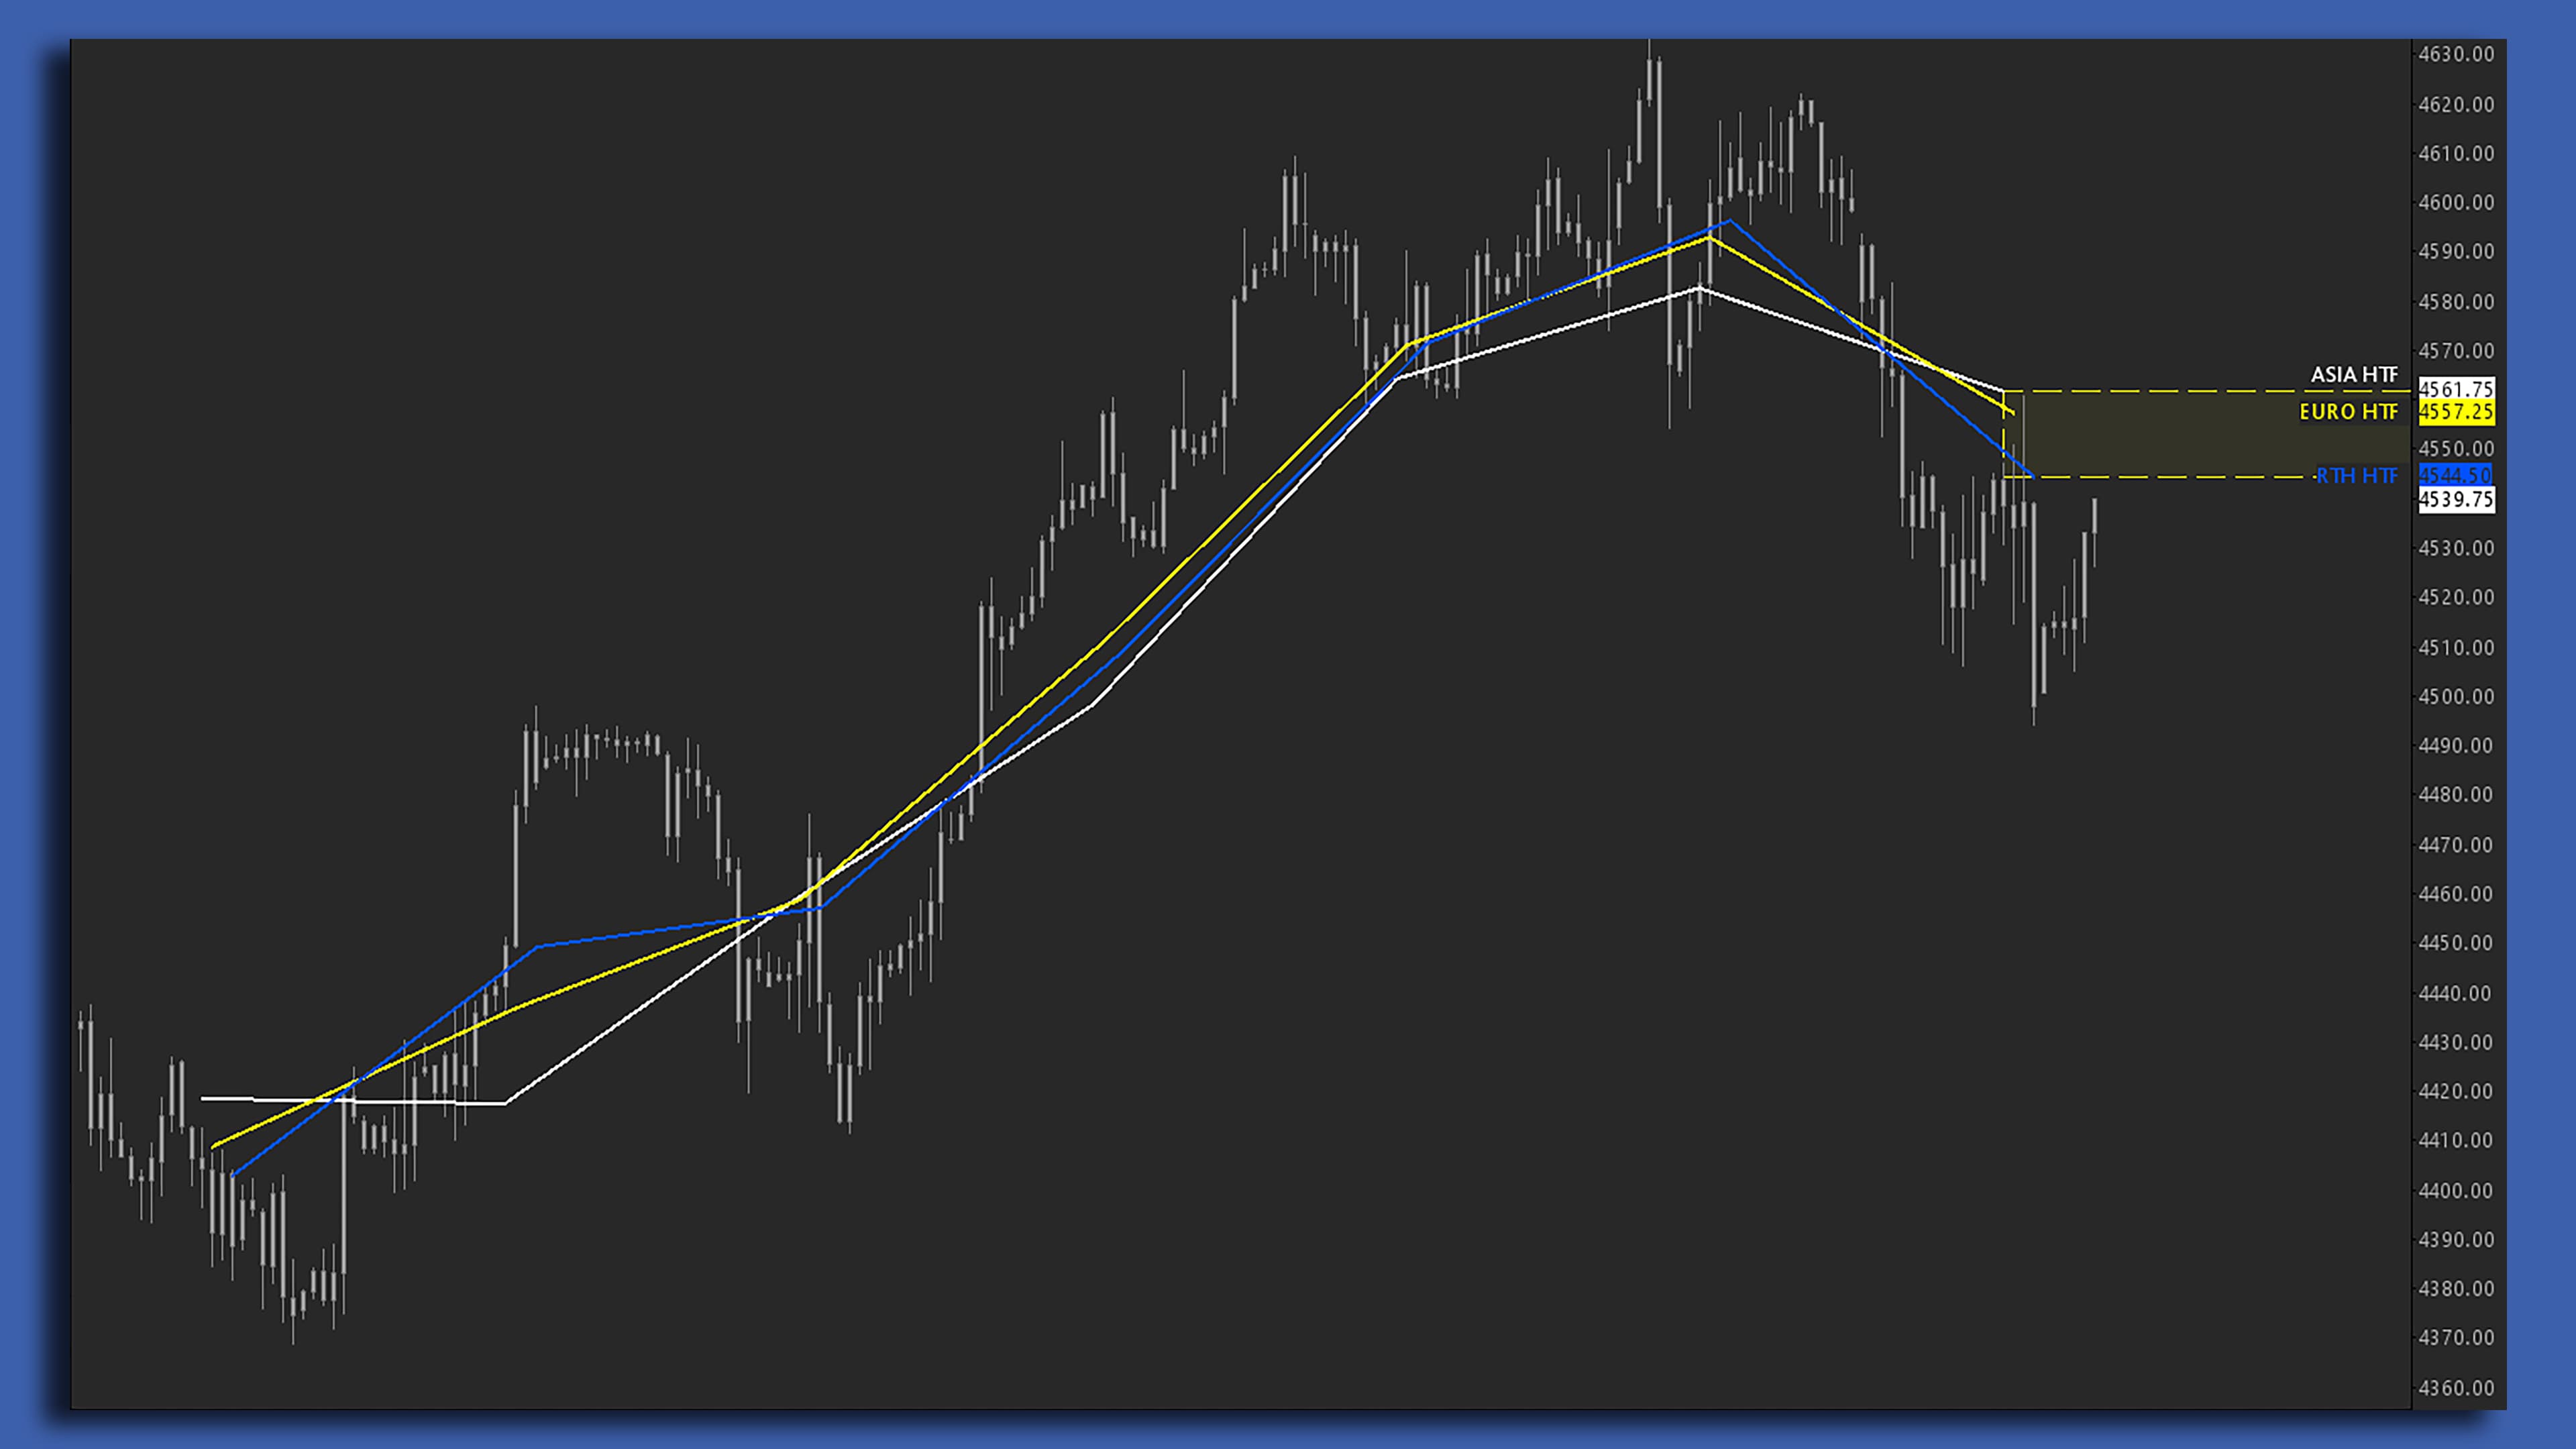
HTF Delta Pivots
Determine a potential weekly range and delta point of control based on the previous week’s LTF Delta Pivots. The HTF Delta Pivots study provides a systematic way to observe the expansion and contraction of the impulsive ranges, giving insight into the possibility of continuation or a fade of the previous week’s auction.
HTF Delta P2P
Organize the pivot data collected from the HTF Delta Pivots in a Point-to-Point configuration, connecting each session’s pivot to the previous to visualize net buying or selling in each session relative to the other sessions.
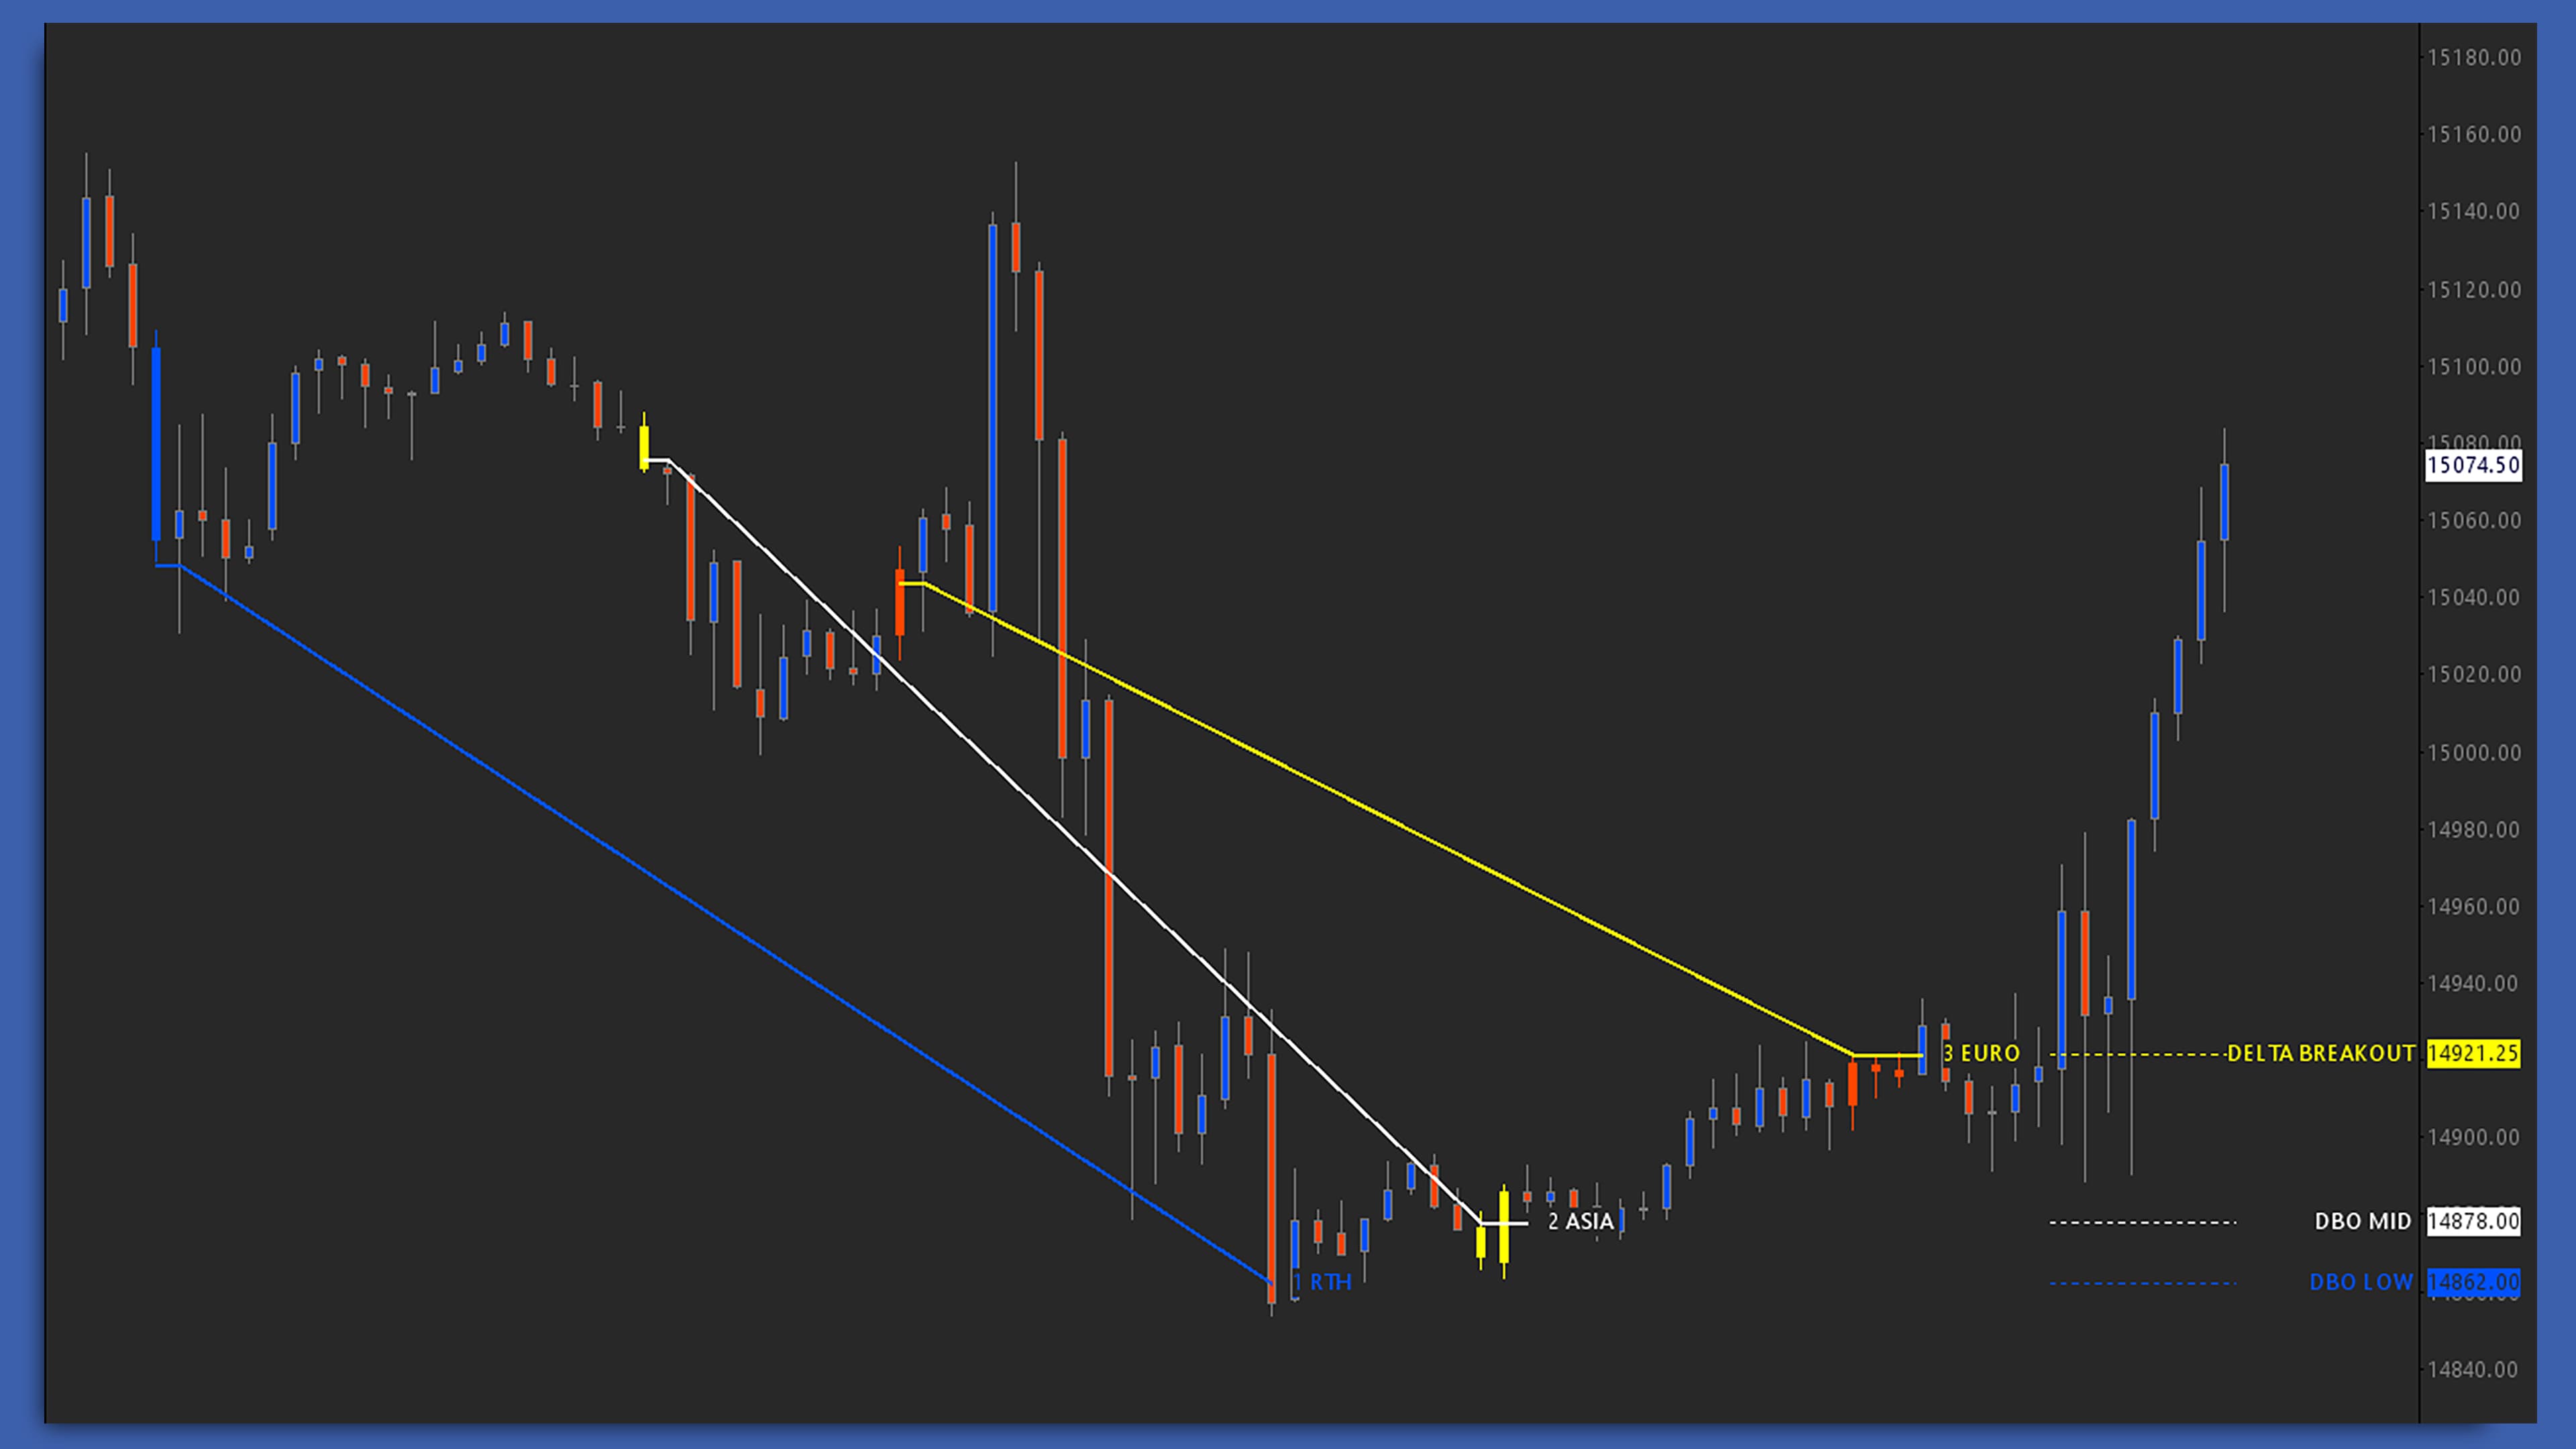
LTF Delta Pivots
Establish the most impulsive range and pivot point over a given timeframe or session. By comparing volume and average rotations, the LTF Delta Pivots study highlights the location where large size and aggression has occurred.
LTF Delta P2P
Organize the pivot data collected from the LTF Delta Pivots in a Point-to-Point configuration, connecting each session’s pivot to the previous to visualize the path of the impulsive auction and monitor for shifts or continuation.
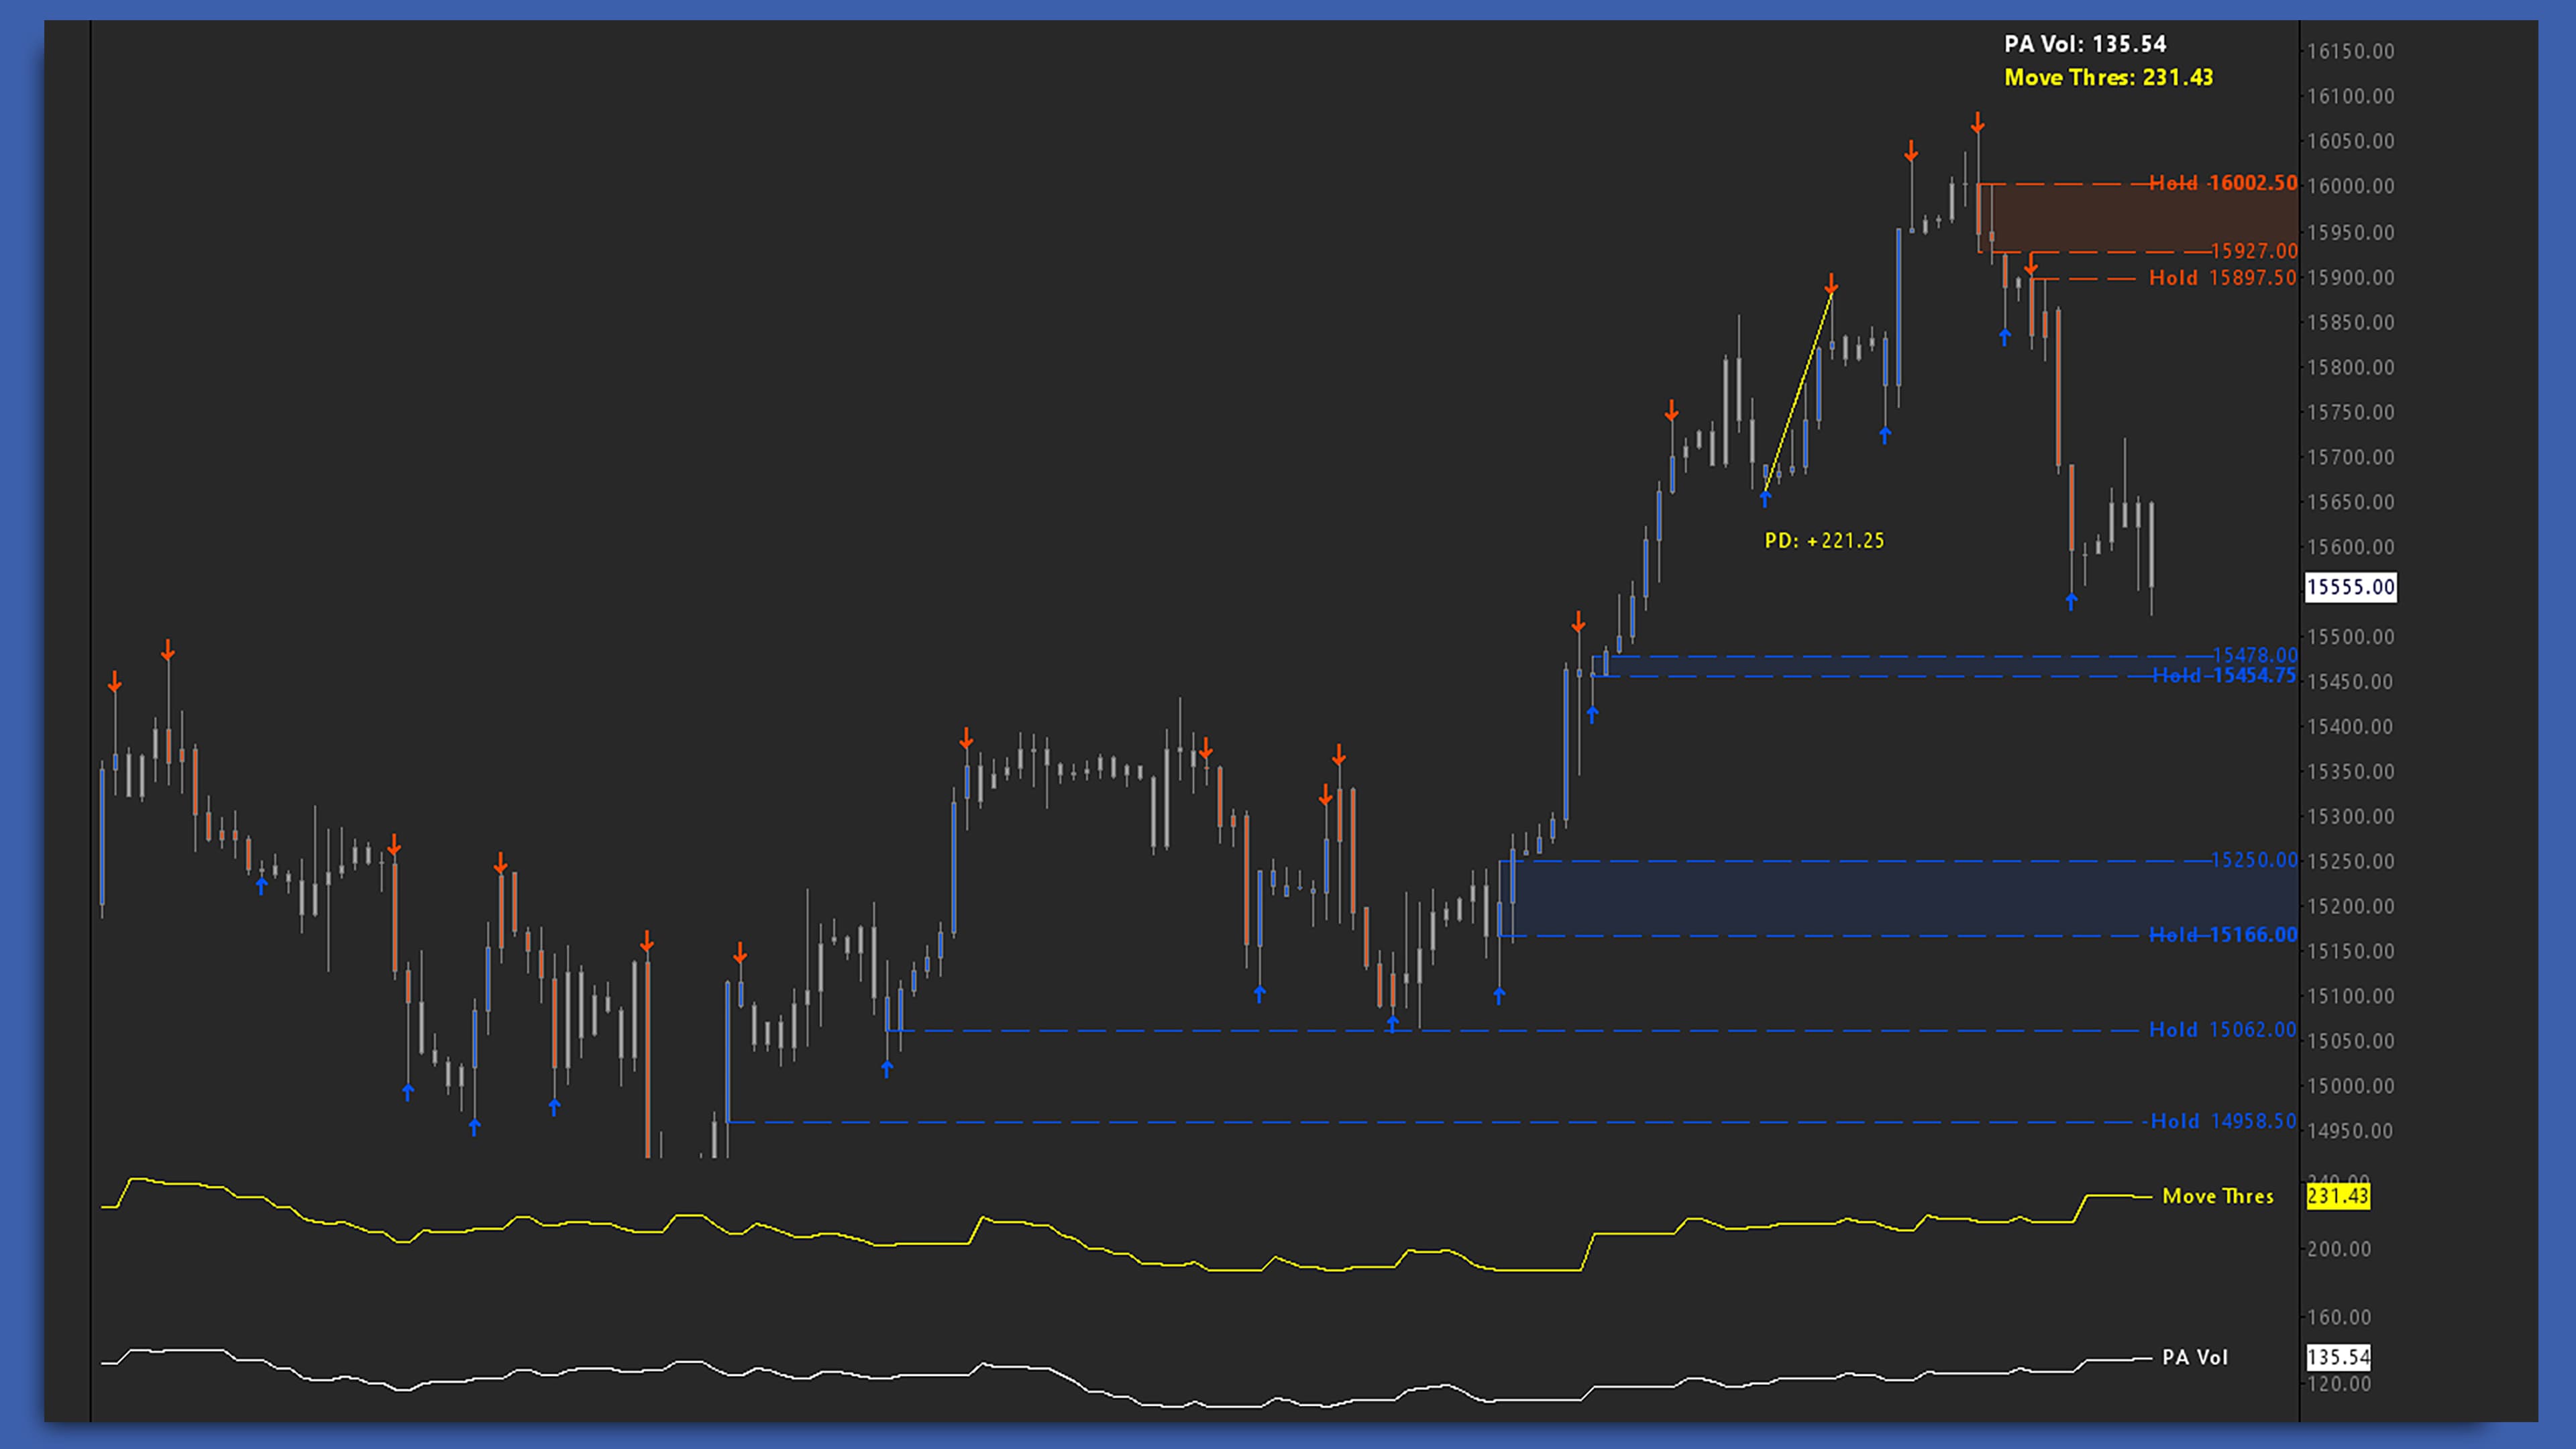
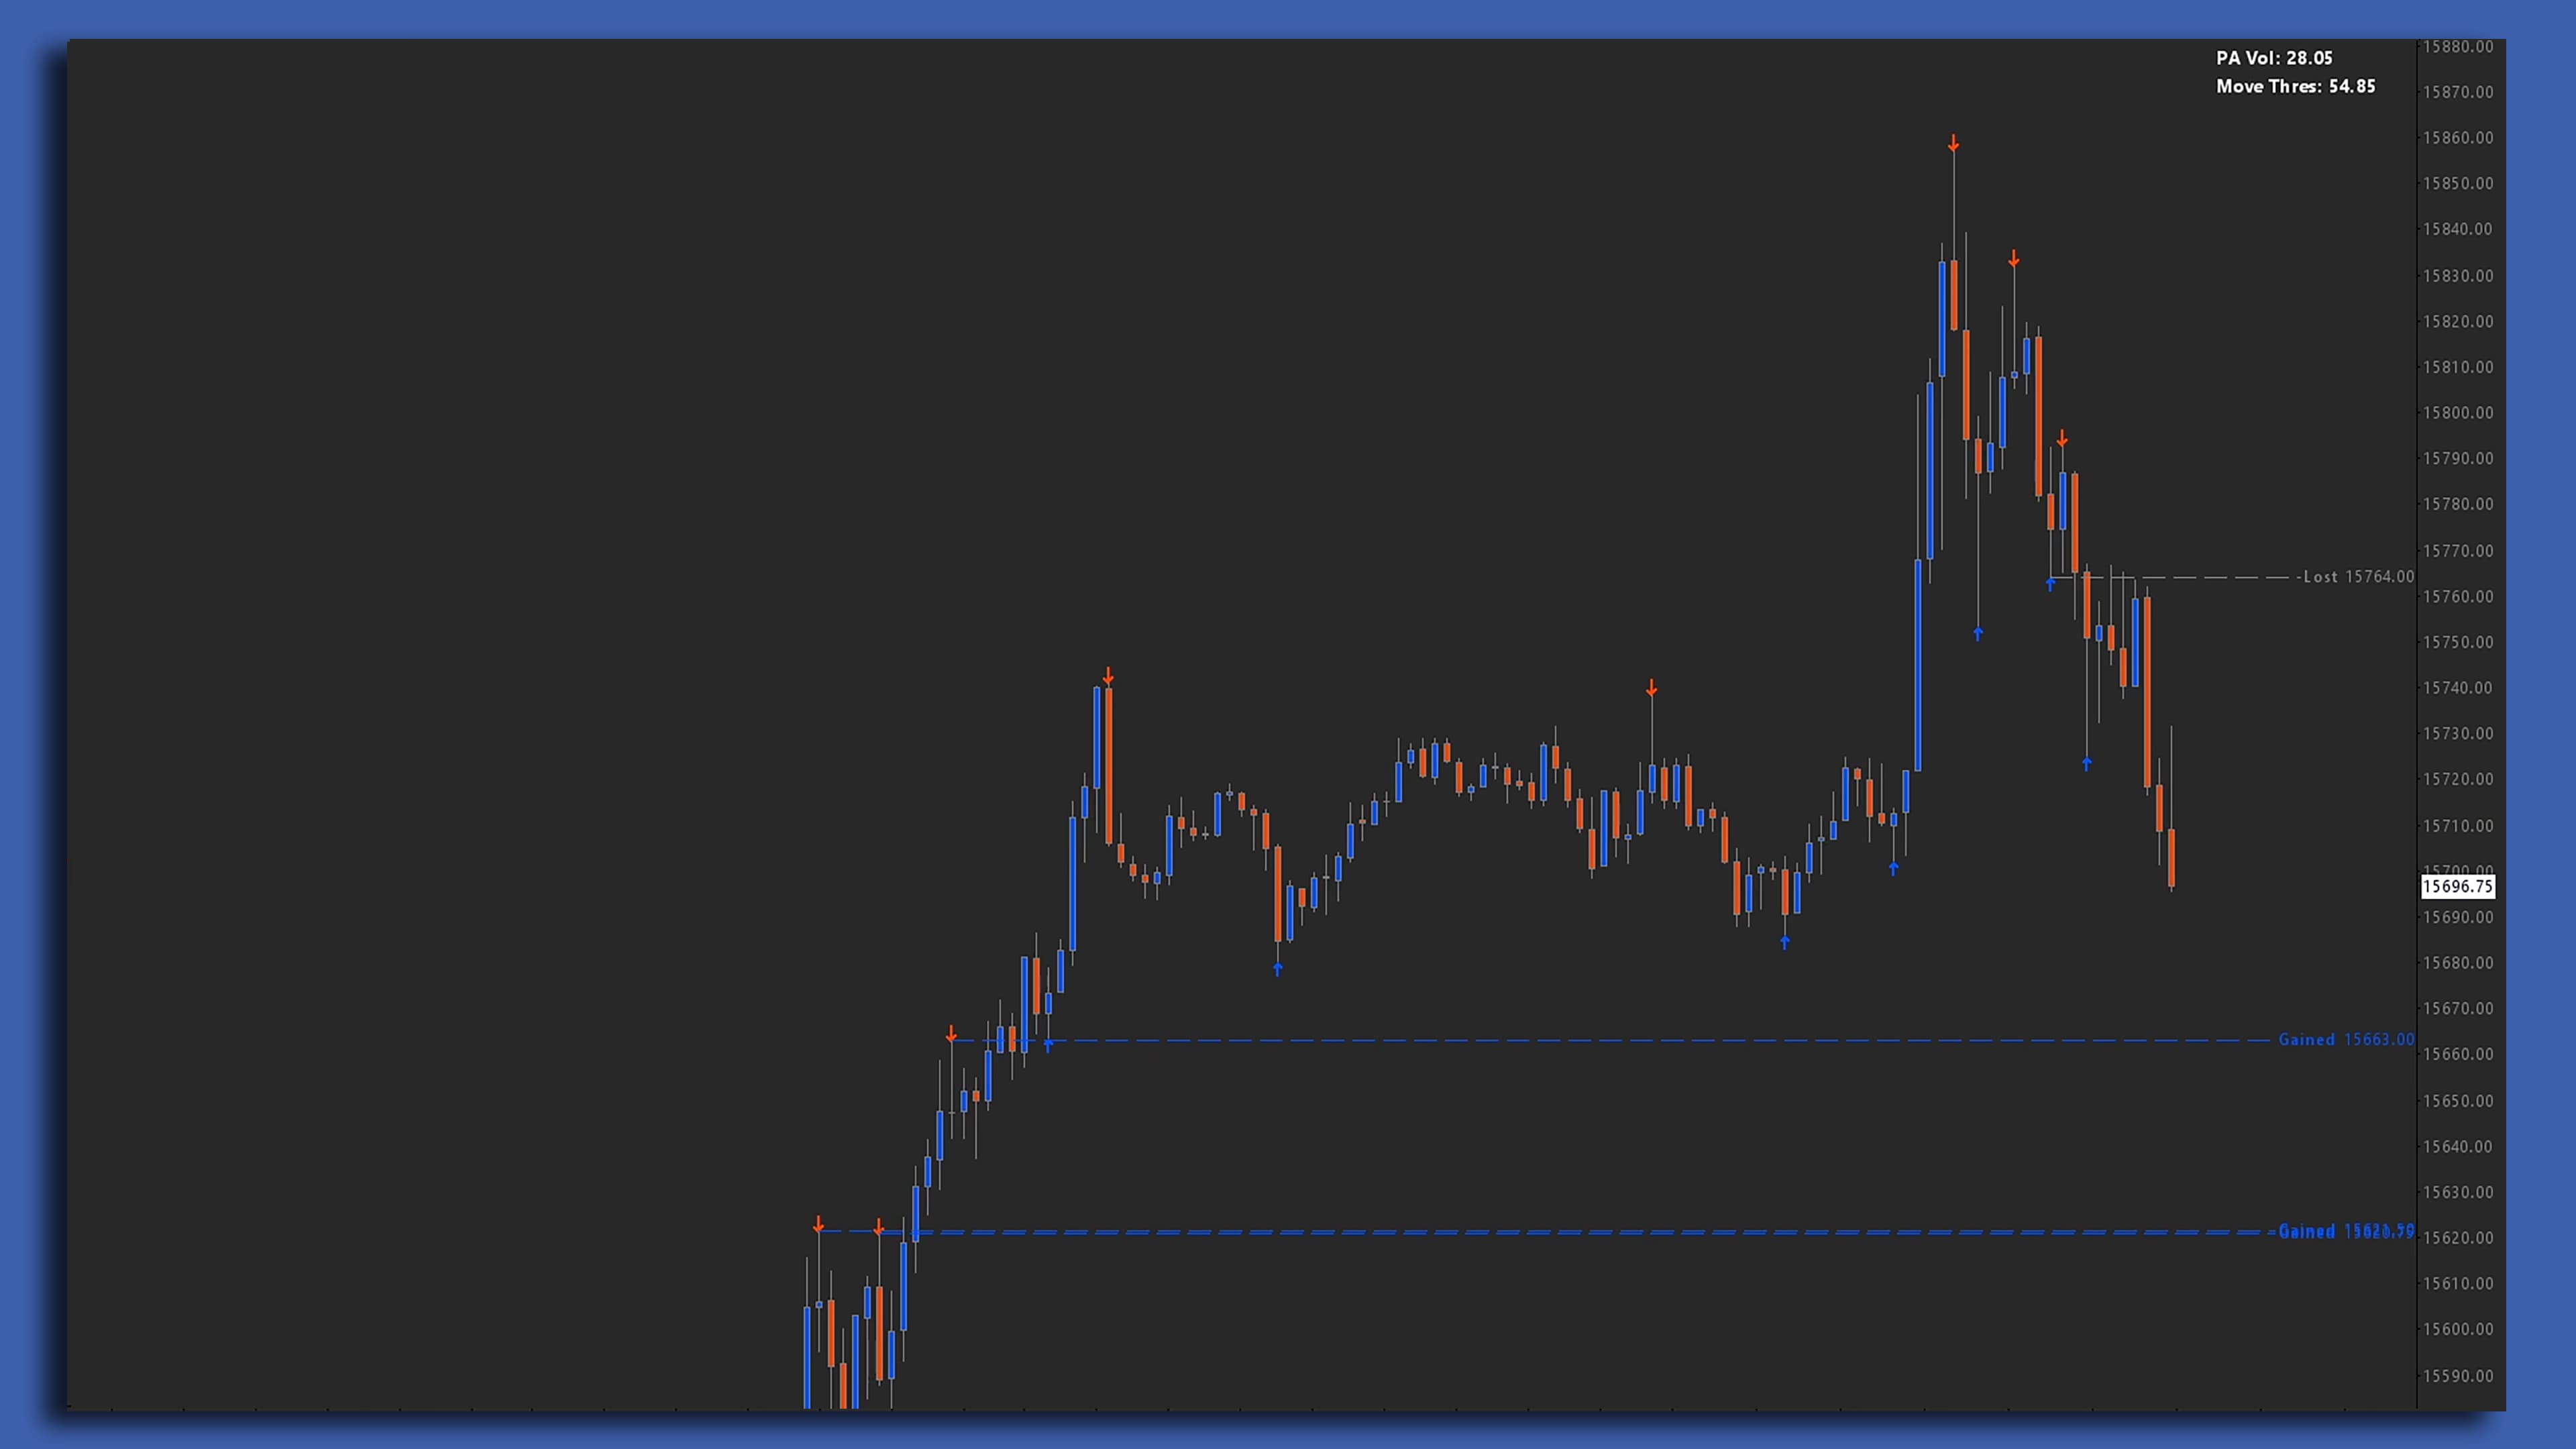
Move Metrics
Adaptively track the historical price action volatility and significant sequences of price action (‘Moves’) to clearly understand how far market reversals have traveled on a given timeframe. Through tracking anomalous swing highs and swing lows, the Move Metrics study helps traders define Gained-Lost Levels study settings, establish take profit targets, and determine risk skew.
Opening Range Break
Based on a manually selected time duration, automatically draw the opening range high, low and mid for any product. Opening Range Break features internal signals for range breakouts and breakdowns and dynamically colors the range as potential trend days develop.
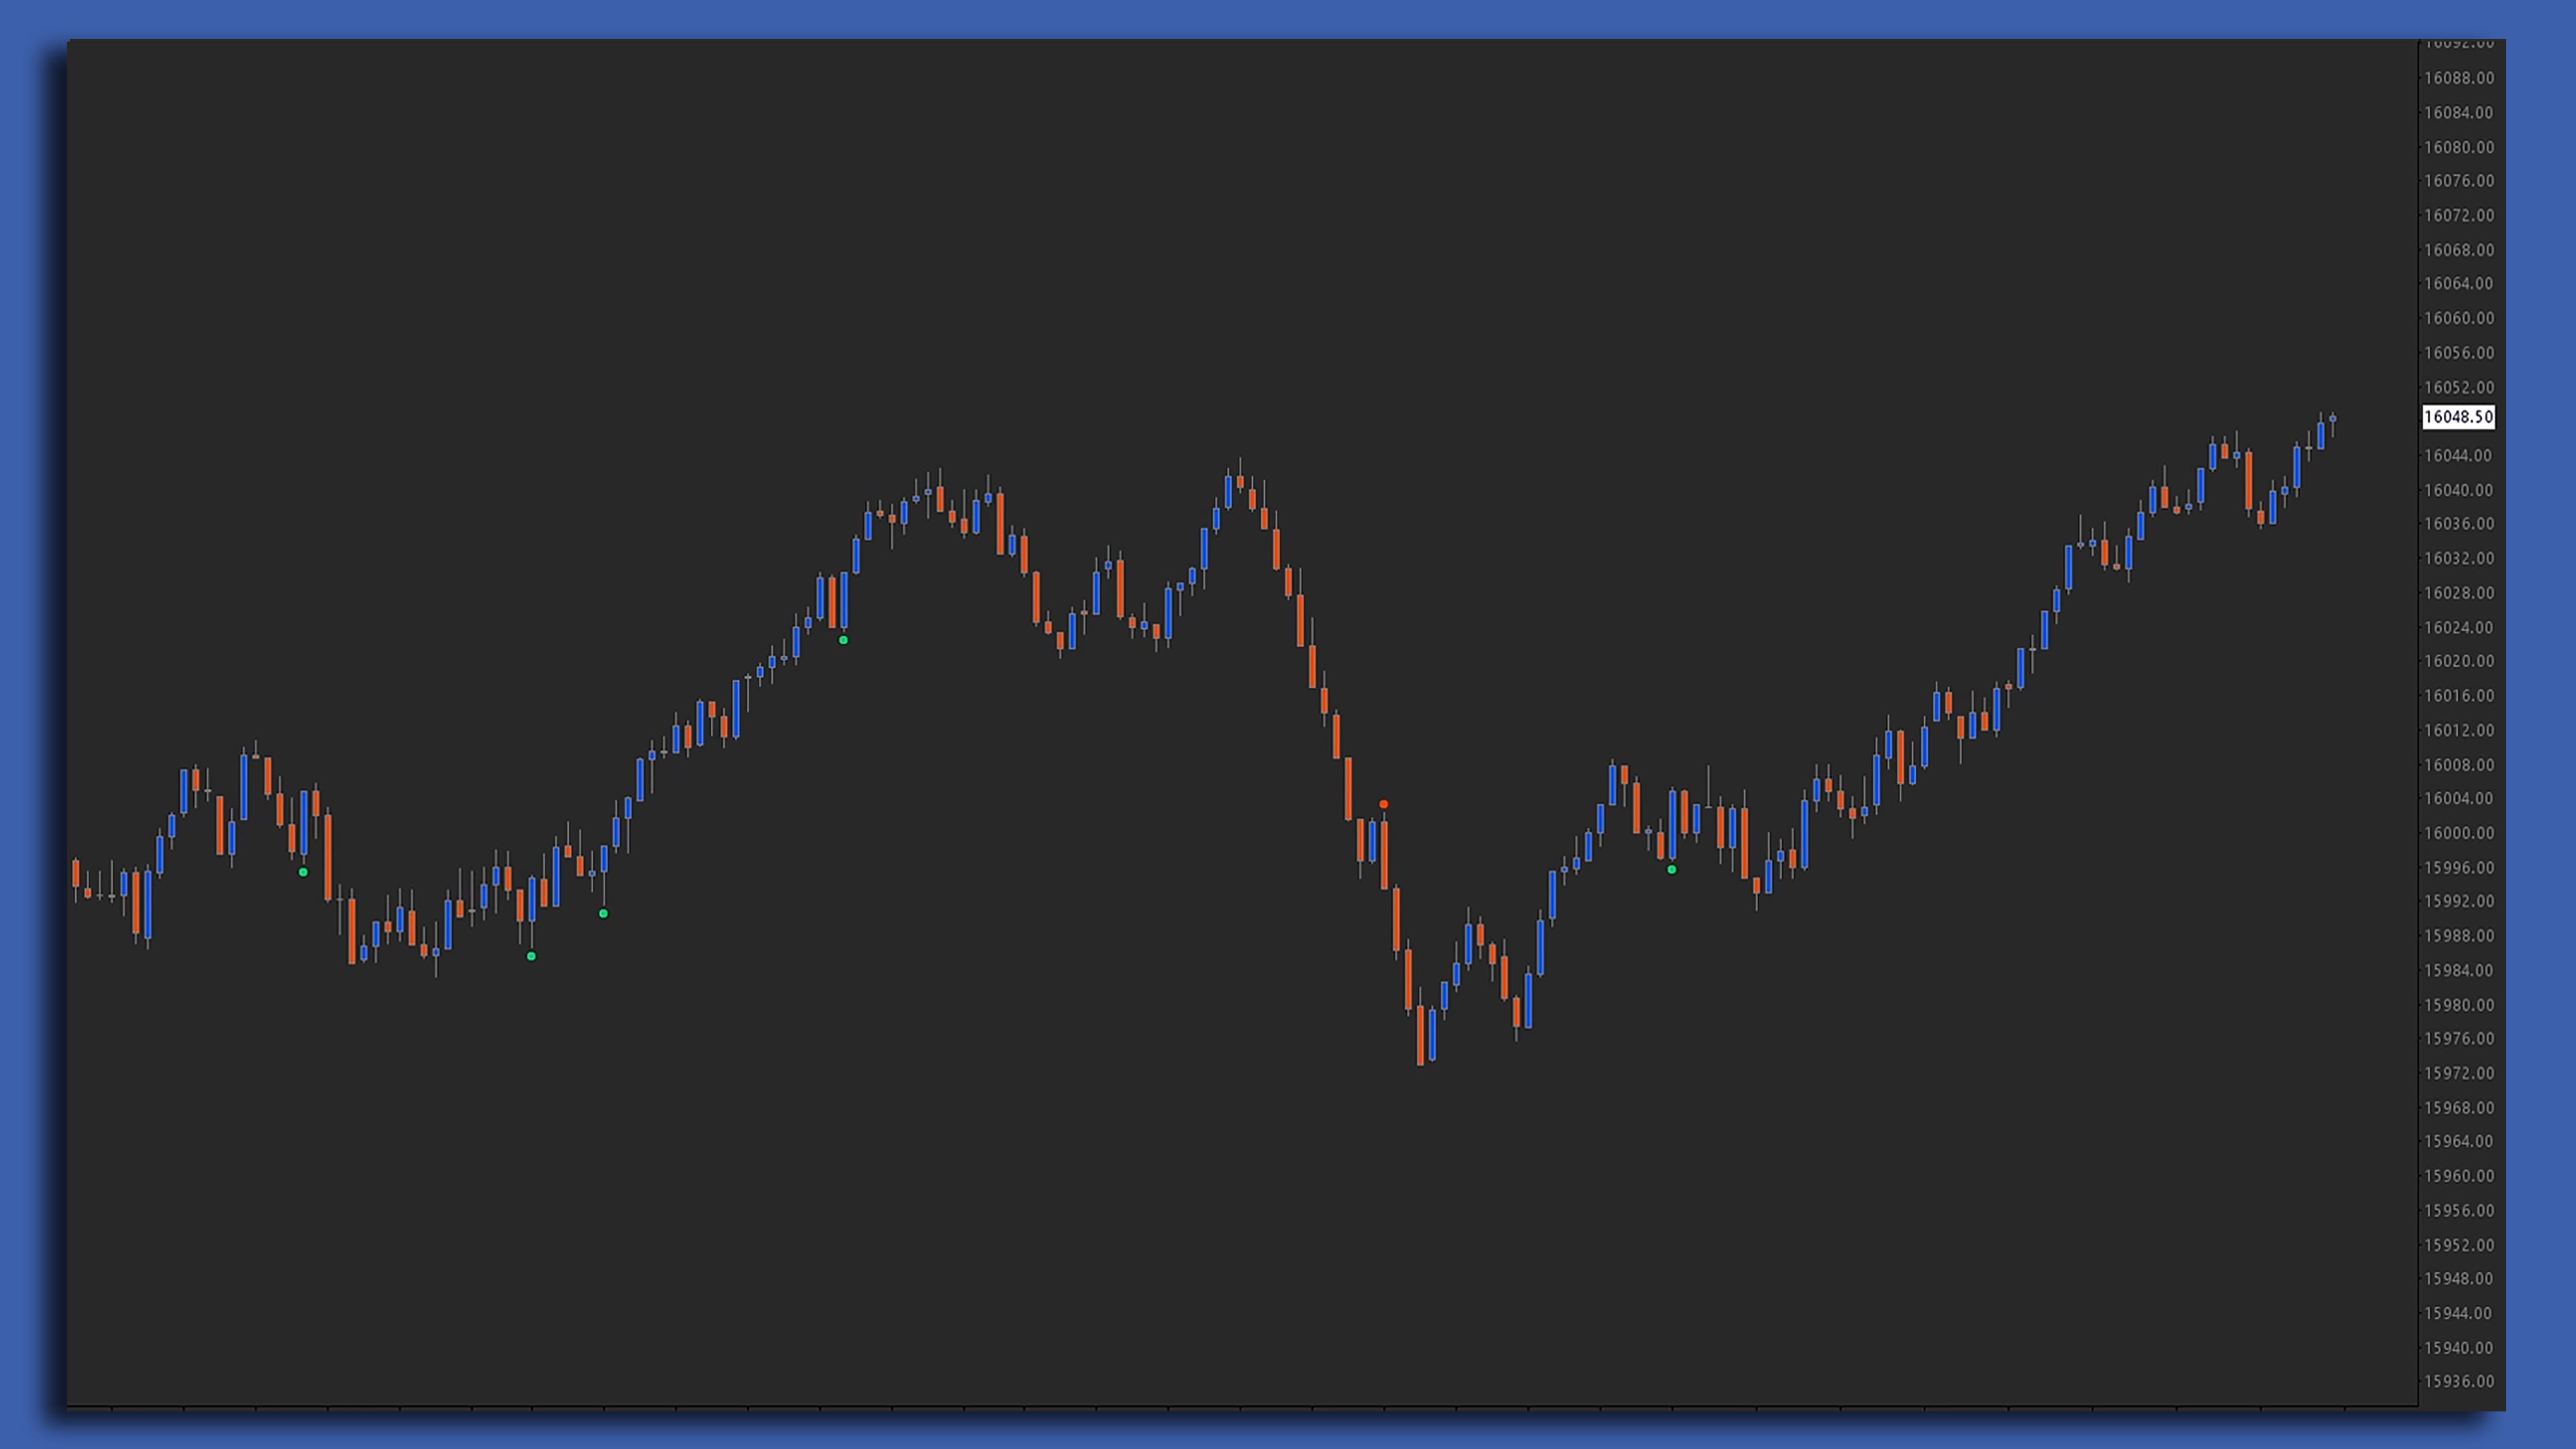
Reversal Bars
A price action based signal which marks an outside bar with an outside close relative to the previous bar. Reversal Bars also provides additional variants which look for previous directional moves allowing traders to filter for a sequence of lower lows/higher highs or one time-framing.
SCAD
Spatial Clustering Applications of Delta, or SCAD, organizes pivot data from the LTF Delta Pivots to automatically draw zones when two or more pivots are plotted within a given price threshold. Providing key structural areas of interest, SCAD allows traders to easily visualize where large traders have repeatedly shown interest in the auction.
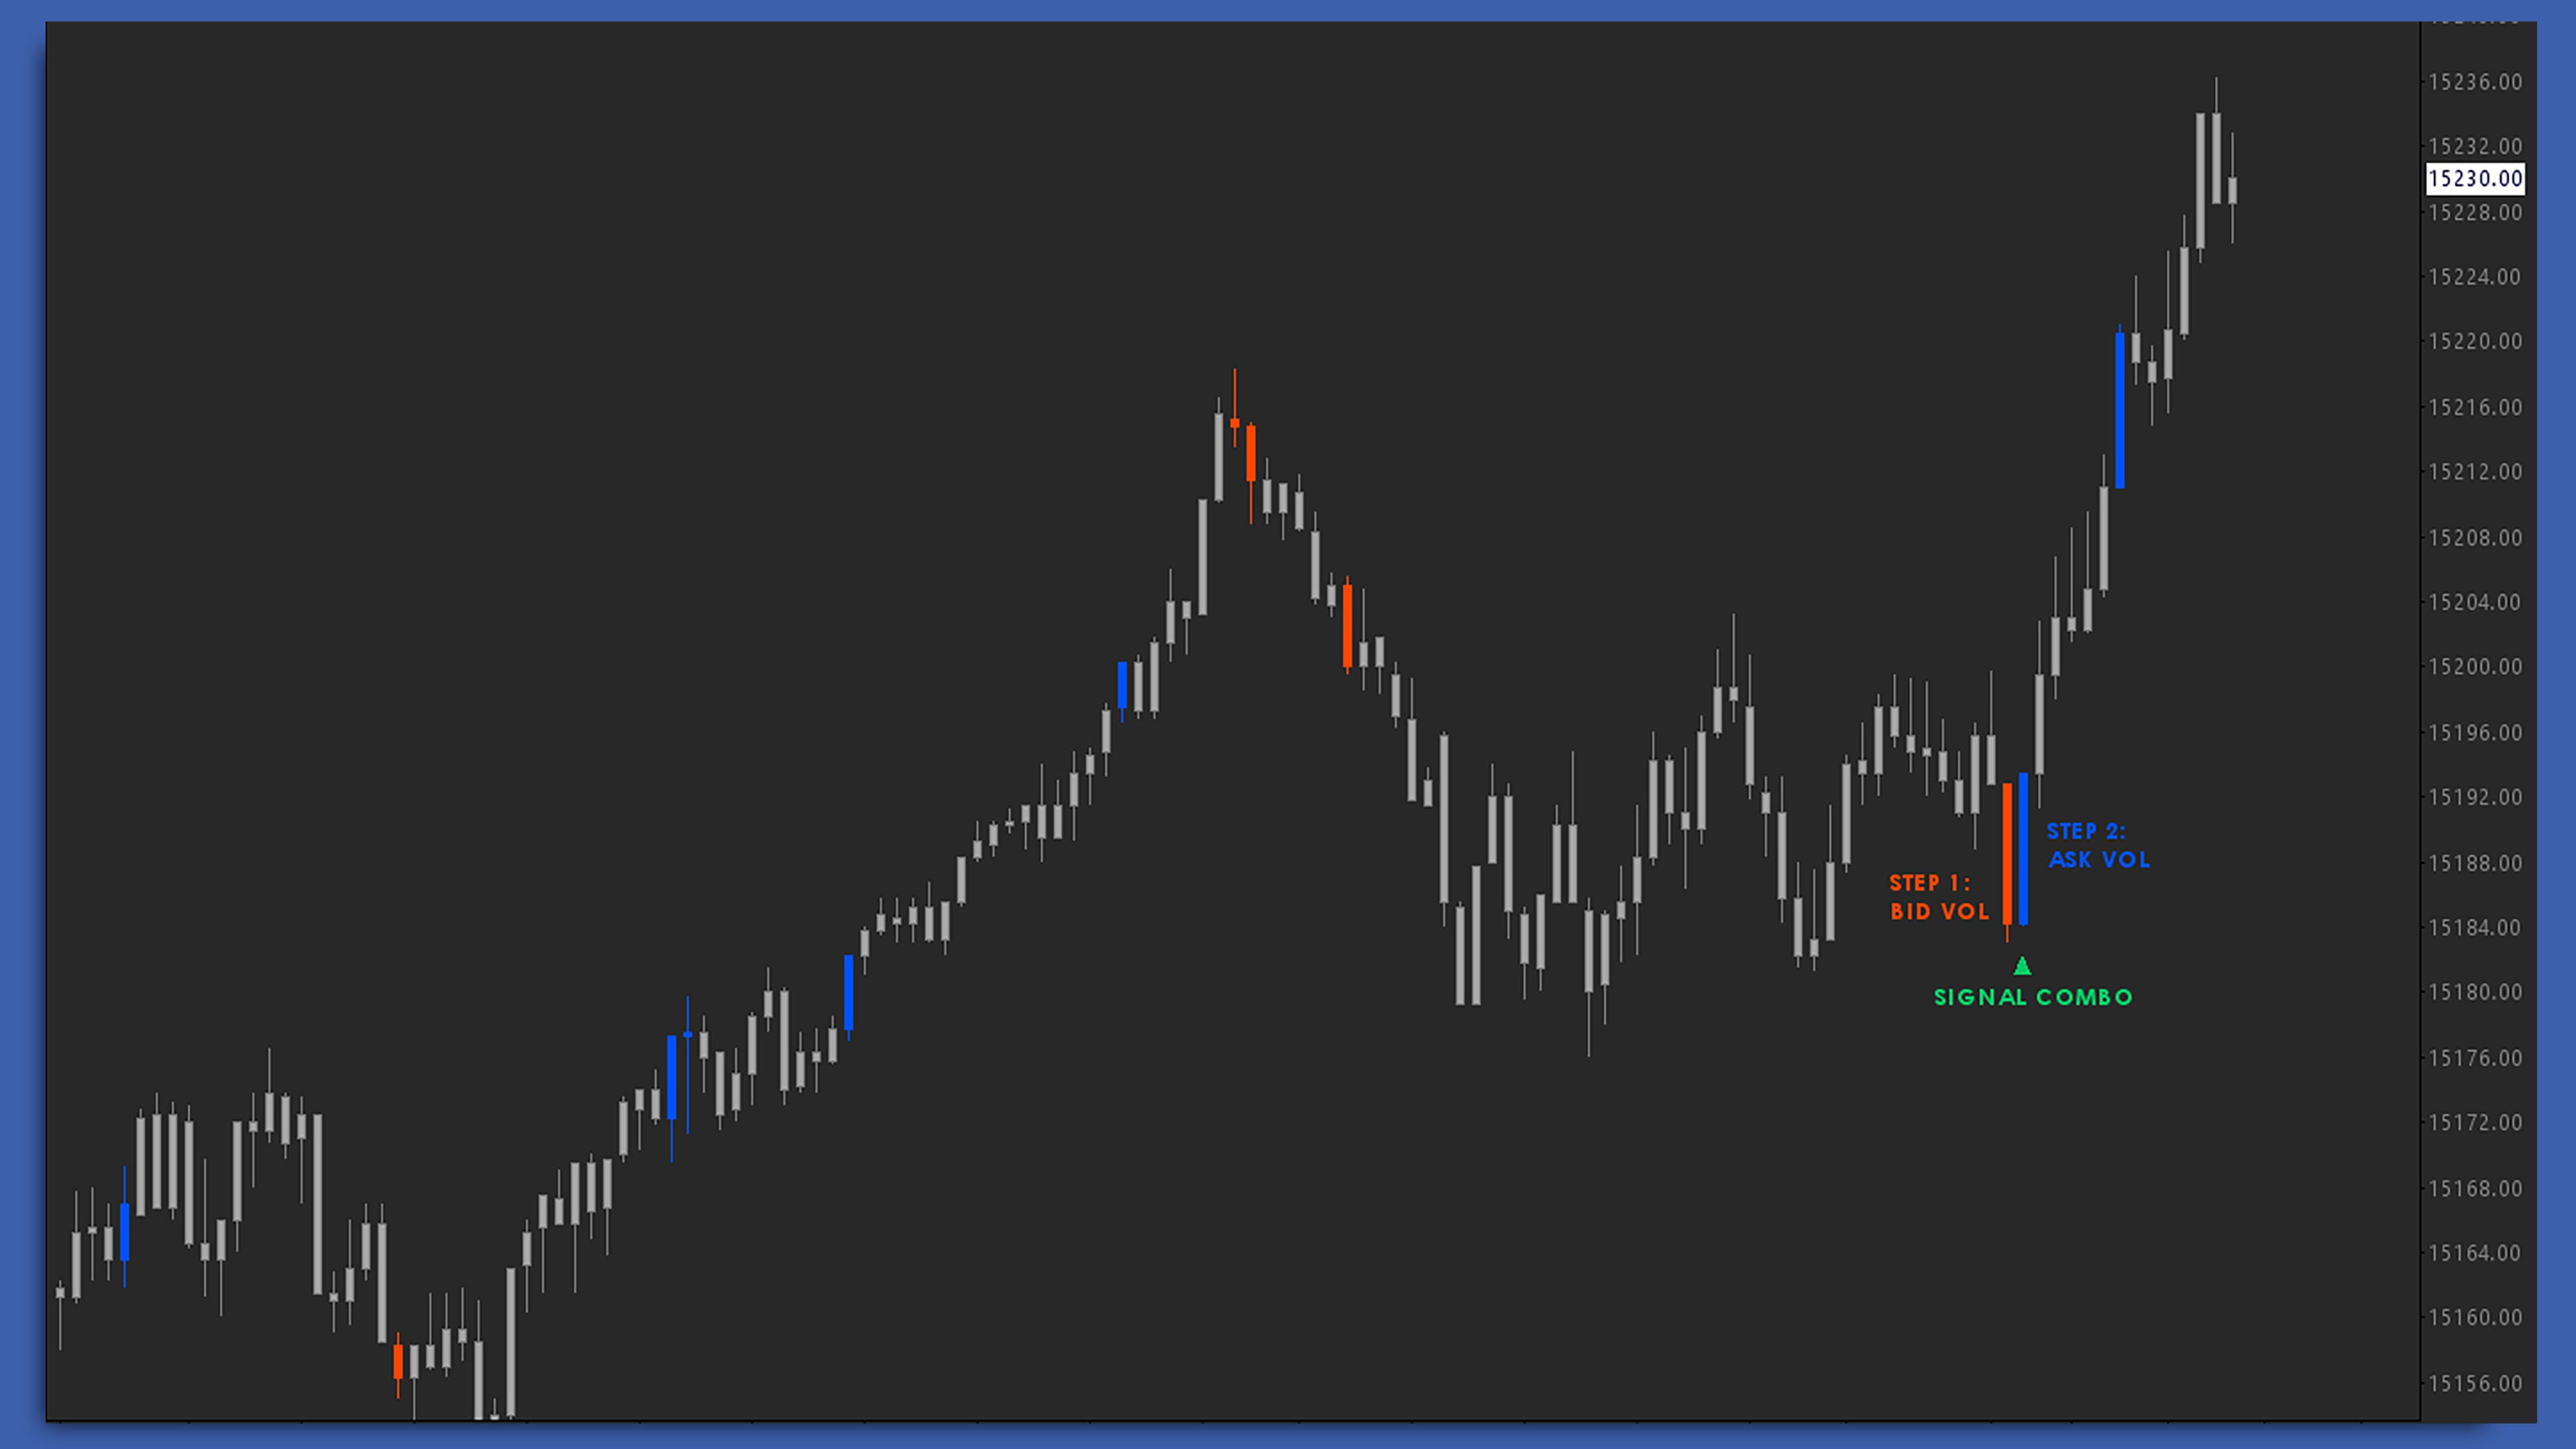
Signal Combo
Design custom buy and sell signals by combining existing signals, subgraphs, and alert conditions. Signal Combo features the ability to generate a custom signal quickly and easily, delineate the amount of lag relative to the conditions, and determine the signal output value.
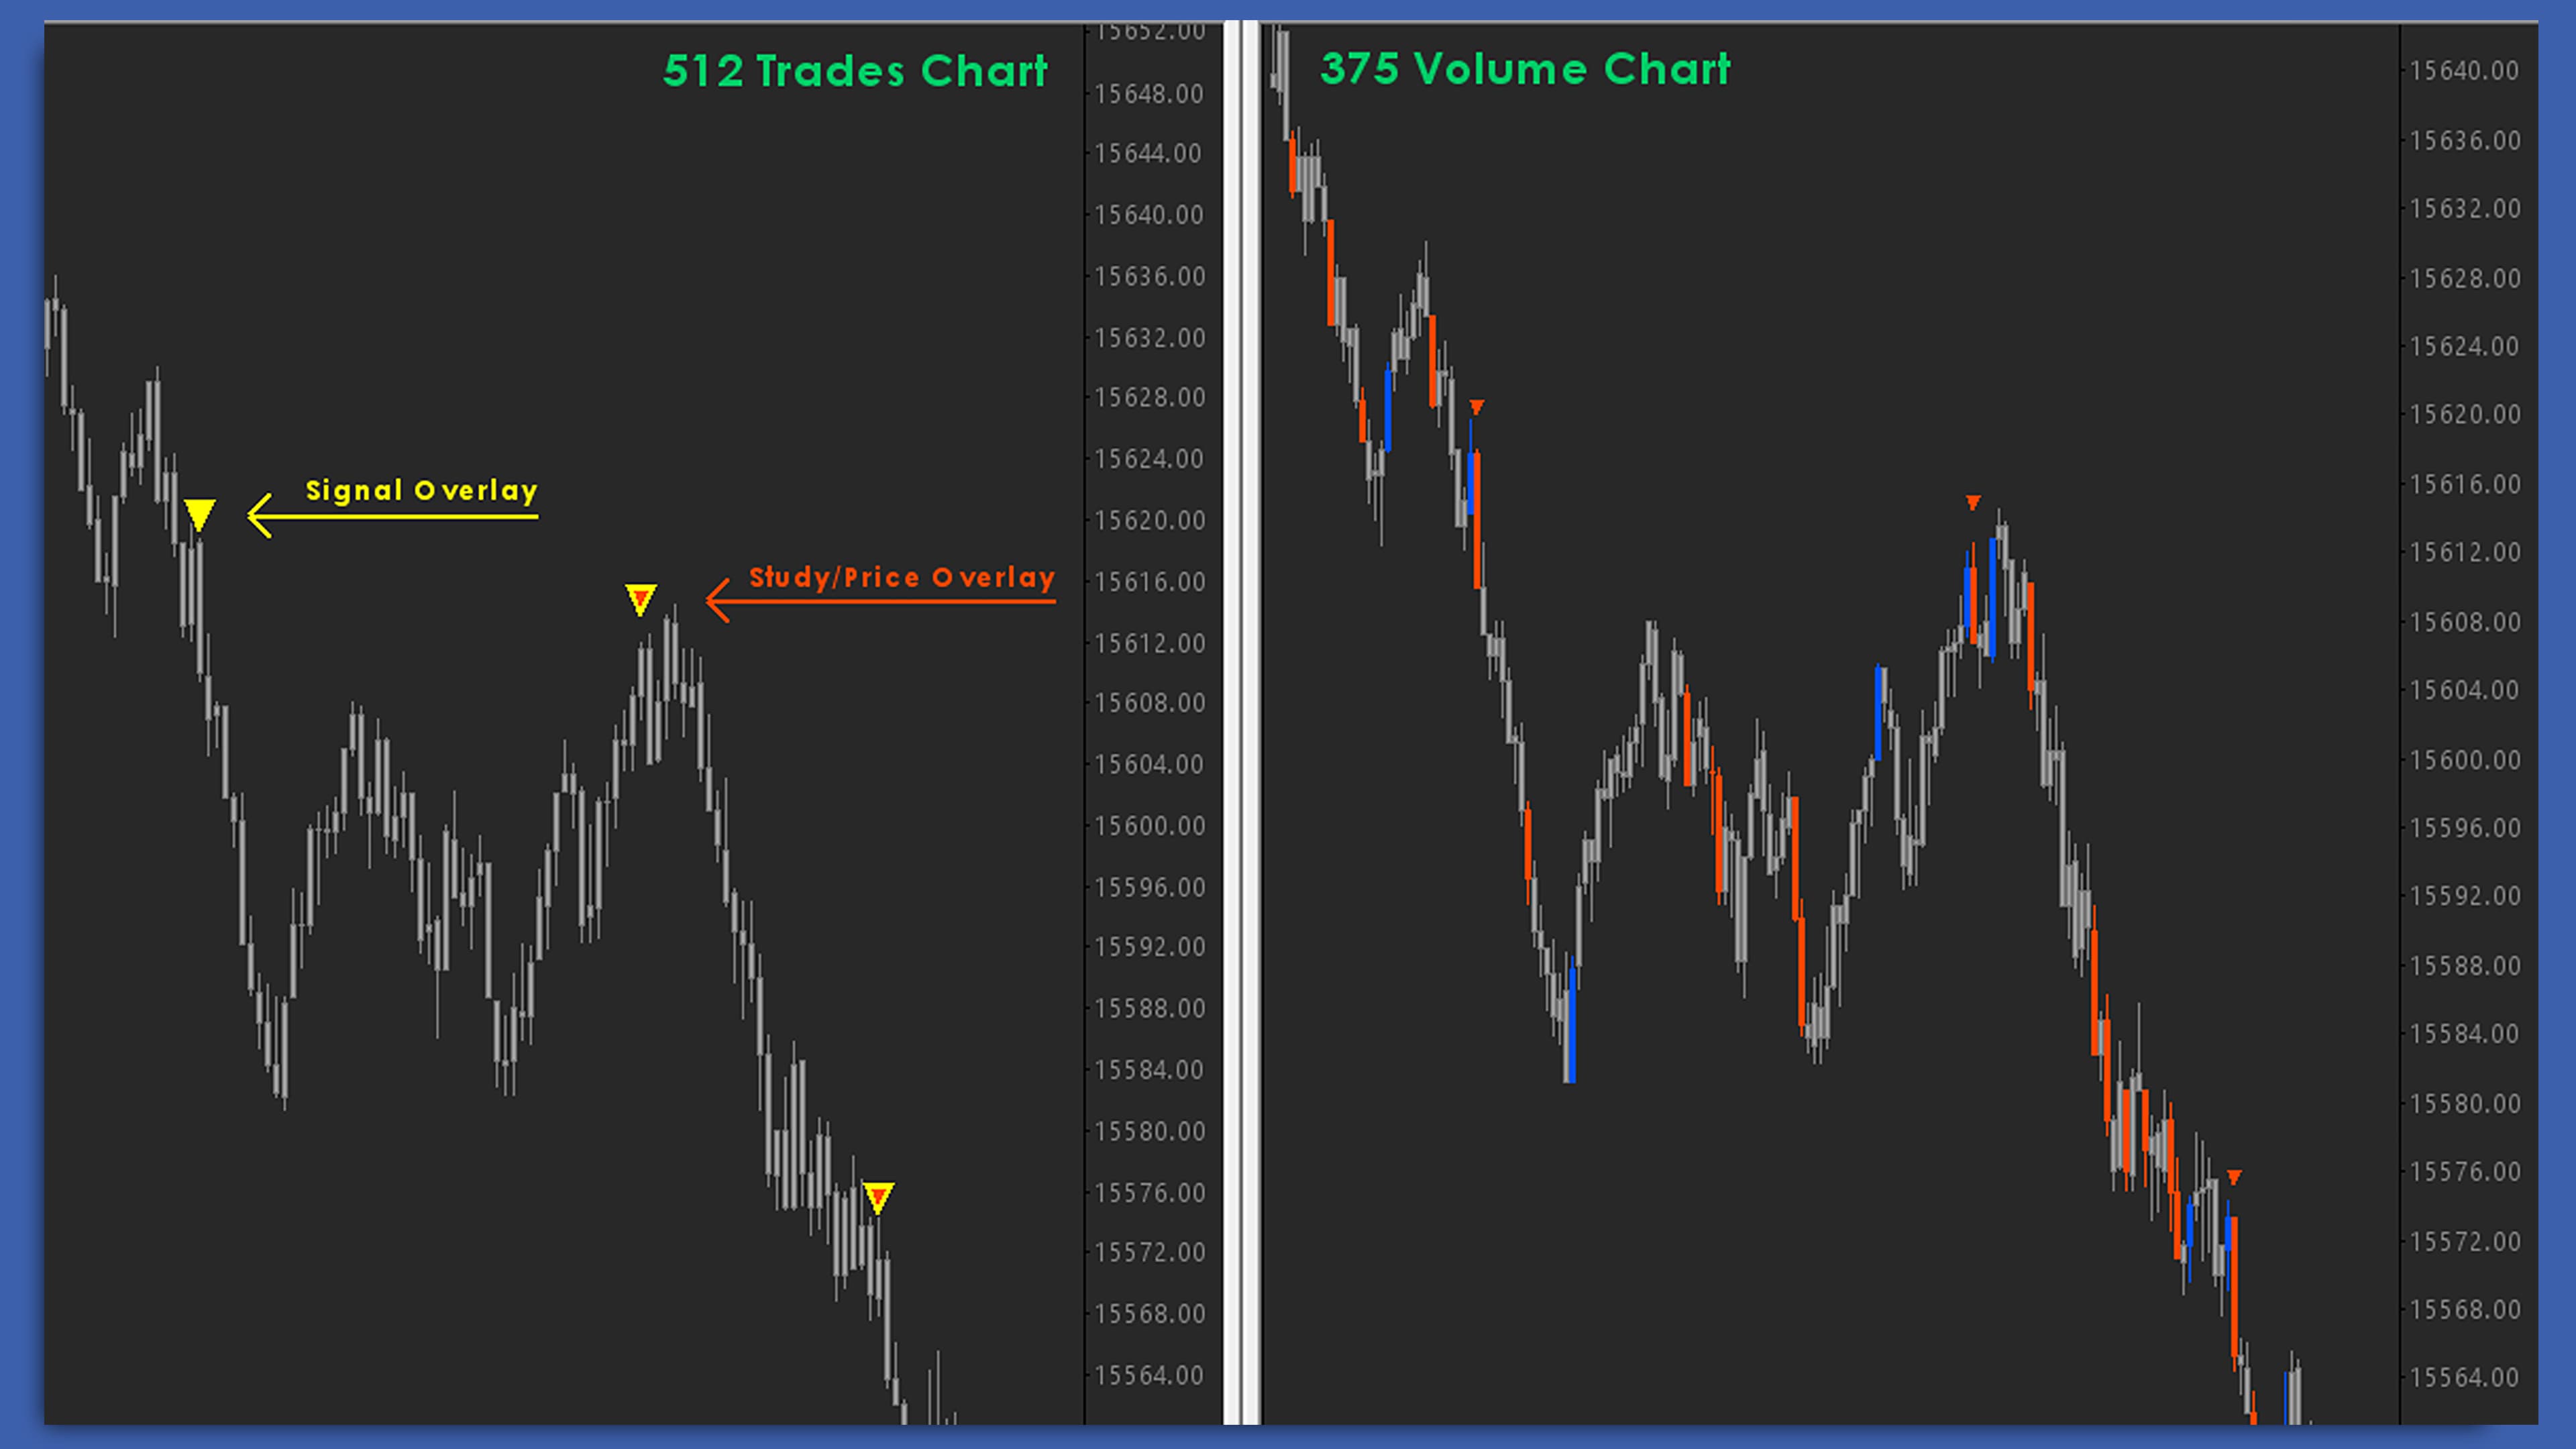
Signal Overlay
Overlay signals and subgraphs and customize automatic refreshes from multiple charts and timeframes. By overlaying information more accurately, Signal Overlay enables you to build execution style charts and visualize low timeframe trends and patterns within the big picture.
Trapped Traders
Identify areas of absorption in real-time to reveal potential trades based on current market liquidity dynamics. When significant players fail to drive the market in their desired direction, the Trapped Traders study highlights zones of support and resistance to reveal potential reversion trades with defined risk.
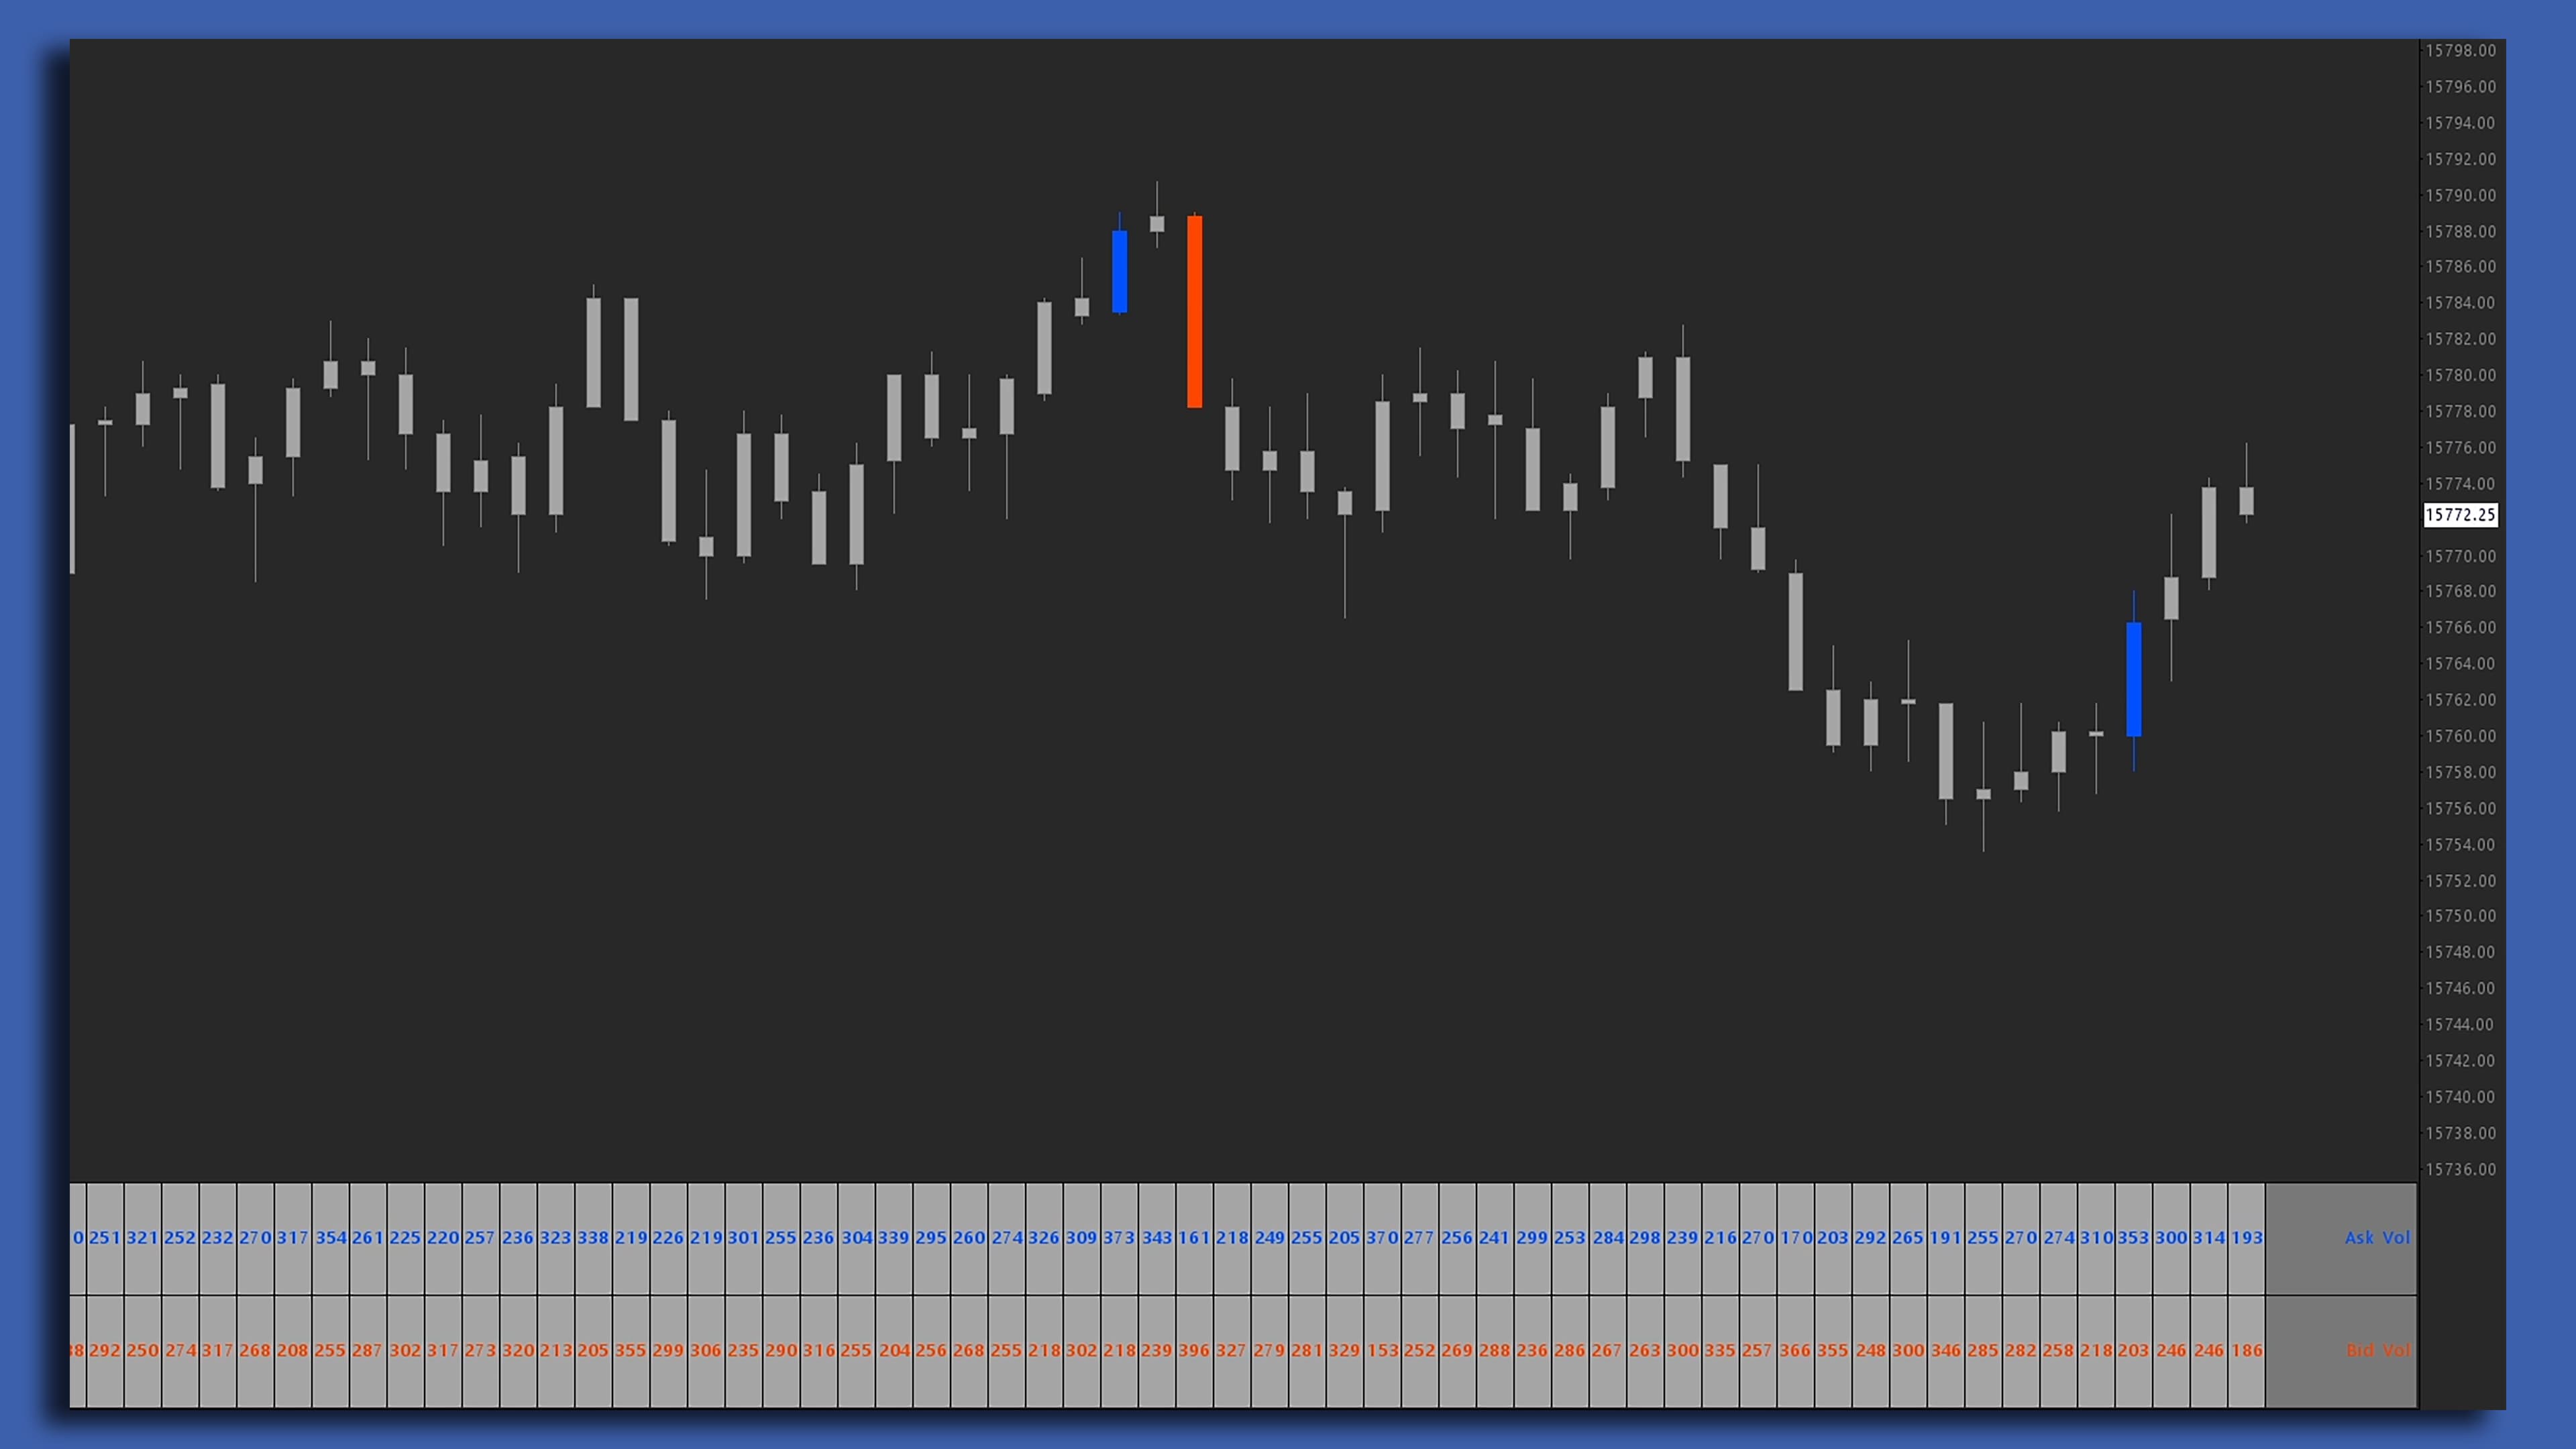
Volume Imbalance
Bring the benefits of the Bid-Ask Footprint directly to your bar chart with color-coded displays. The Volume Imbalance study locates anomalies in bid or ask volume where one-sided trade has occurred.
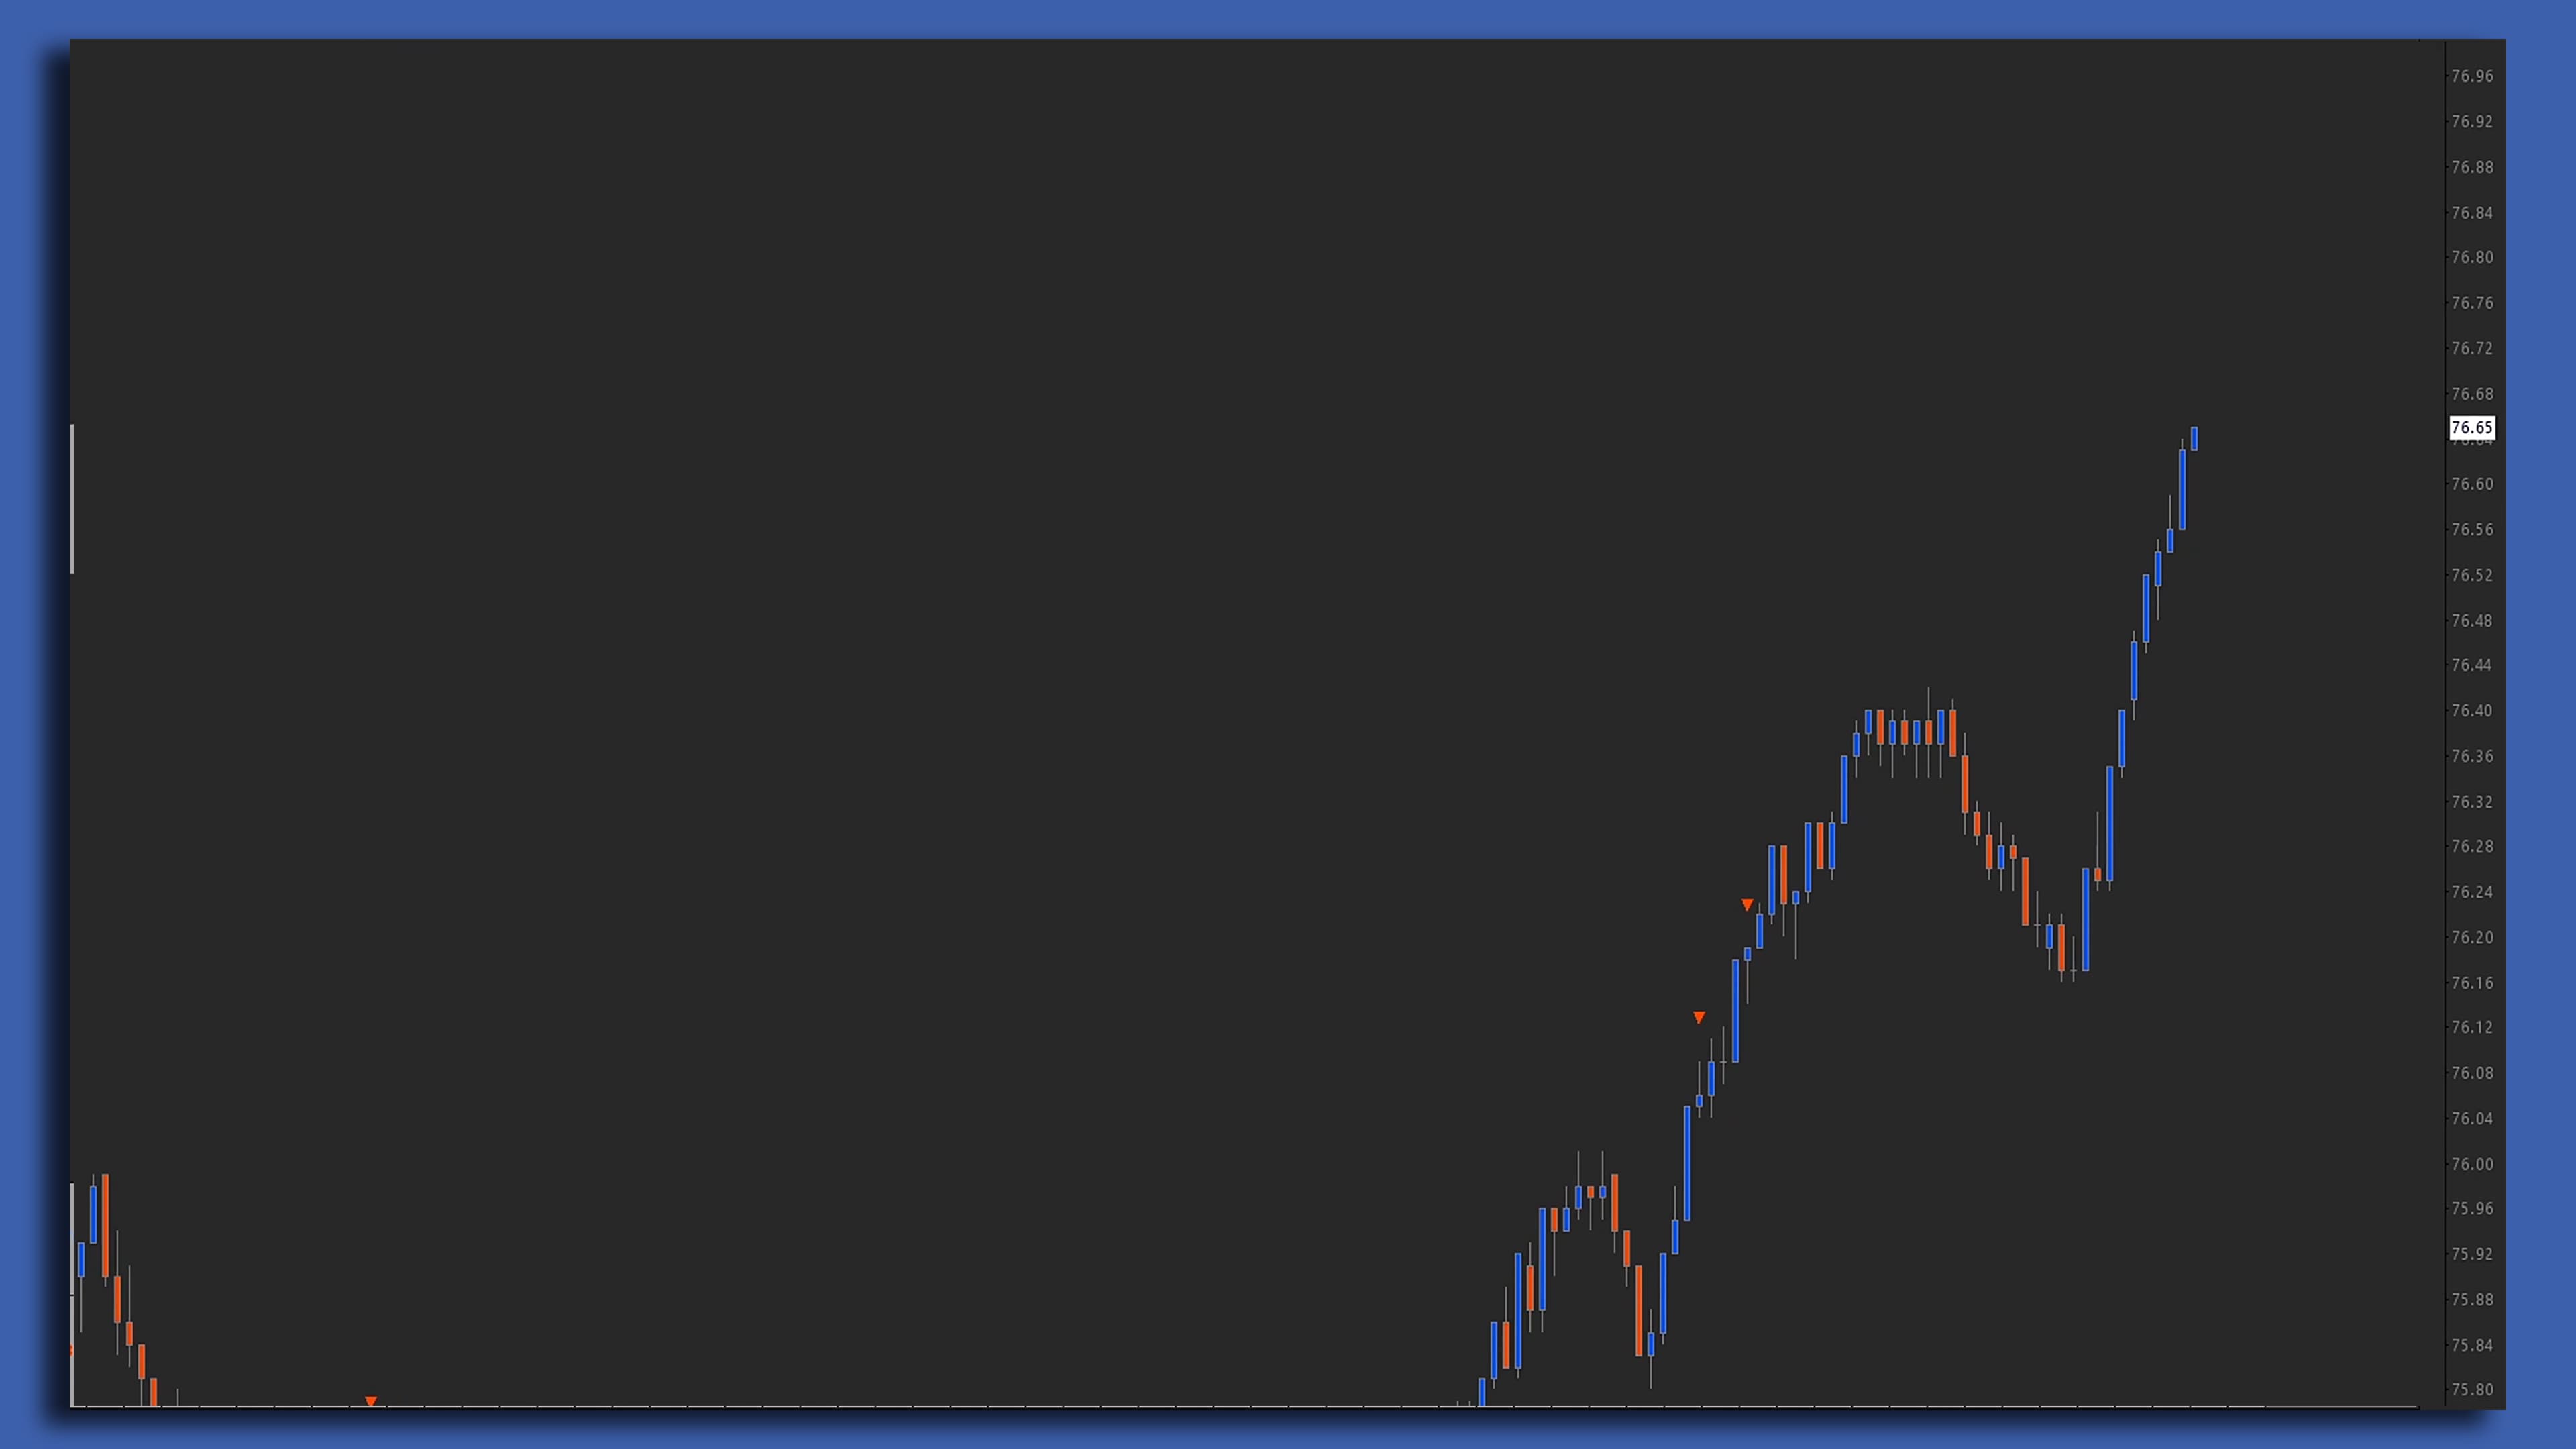
Volume Impulse
Combining information derived from speed and delta to pinpoint attempted reversals, the Volume Impulse study – particularly when used in conjunction with other signals and areas of interest – validates the reversal and provides confirmation to the attempt for a directional shift.
Start your subscription
Monthly and annual Prop Alpha Pro plans include DLL access and onboarding support.
Purchase